
Advertisement
Advertisement
Crude Oil Price Forecast: Oil Reclaims 50-Day MA, Eyes Bull Flag Breakout
By:
Oil’s recent consolidation suggests a bullish breakout is building, supported by a reclaimed 50-Day MA, bull flag formation, and upside targets near $69.
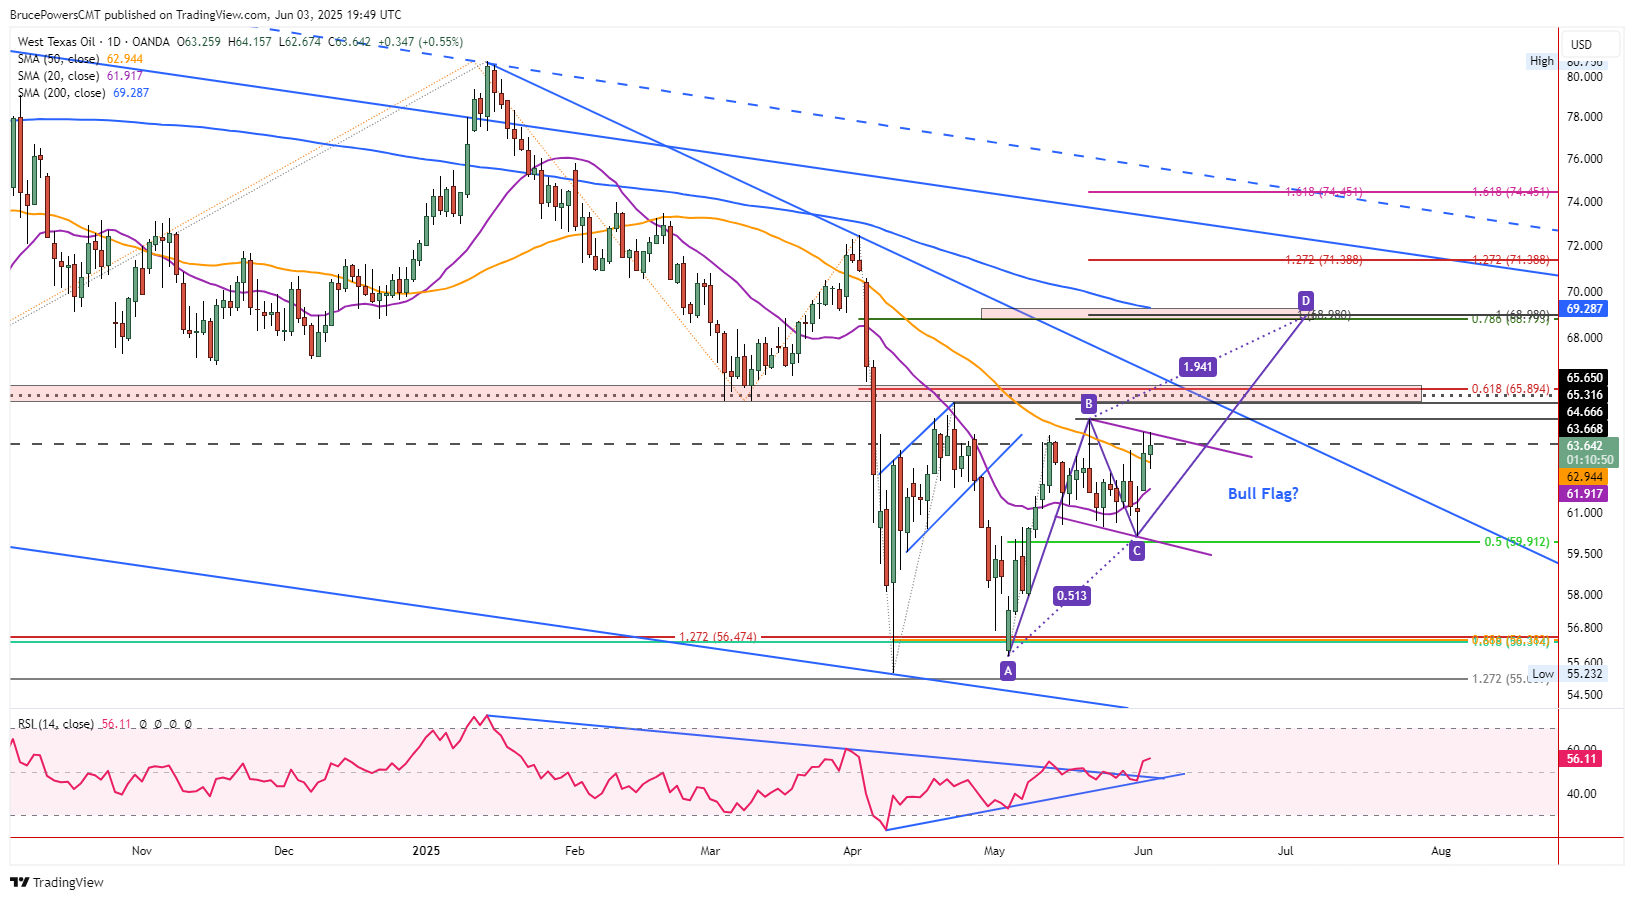
Crude oil has been working on establishing a potential bottom for a couple months and has recently begun to show new signs of strengthening. On Tuesday, crude oil consolidated and will establish an inside day with a high of $64.16 and a low of $62.67. This followed a reclaim of the 50-Day MA on Monday, which was confirmed by a daily close above the 50-Day line, currently at $62.95. Also, a weekly breakout triggered above last week’s high of $63.43.
50-Day Line Reclaimed
That was the first daily close above the 50-Day MA since April 2. Tuesday’s low of $62.67 was a successful test of support of the 50-Day line and today’s closing price will likely be above that line for the second day in a row. Once prior resistance is shown as support, the trend is showing signs of wanting to go higher.
Nonetheless, price structure takes precedence, with a series of recent lower swing highs remaining intact. The last lower swing high of $64.67 is a crucial pivot point. A decisive rally above it will trigger a continuation of the advance that began from the second recent bottom at $55.81 in early May.
Potential Bull Flag Forms
Over the past month or so crude has been consolidating within a relatively narrow range that has now taken the form of a potential bull flag (purple) trend continuation pattern. Dynamic resistance is marked by a top falling purple line connecting yesterday’s high. Therefore, a rally above Monday’s high of $64.16 will provide an initial flag breakout signal, with a second and confirming signal above the top of the flag at $64.67.
An ABCD pattern covering the flag pattern shows a potential upside target around $68.98, which aligns with a potential resistance zone marked by the 78.6% Fibonacci retracement at $68.80 and the 200-Day MA, now at $69.29. The 200-Day line marks the top initial target for crude oil if it continues to strengthen. Keep in mind that the 200-Day MA is falling and getting closer to the Fibonacci and ABCD target.
Key Pivot at $64.67
Nevertheless, there are lower potential resistance zones that need to be reclaimed before the 200-Day line is approached. Most obvious is the prior swing high of $65.32. That price level is near prior long-term support at $65.40 and it can be considered as part of a price range that goes up to the 61.8% Fibonacci retracement level at $65.89.
For a look at all of today’s economic events, check out our economic calendar.
About the Author
Bruce Powerscontributor
Bruce has been involved in the financial markets for over 20 years, as an analyst, trader, educator, and writer.


Advertisement