
Advertisement
Advertisement
Crude Oil Price Forecast: Multiple Bullish Patterns Support Breakout Case
By:
Multiple bullish patterns are forming in crude oil, with a decisive move above $64.67 likely triggering an advance toward key Fibonacci and ABCD targets.
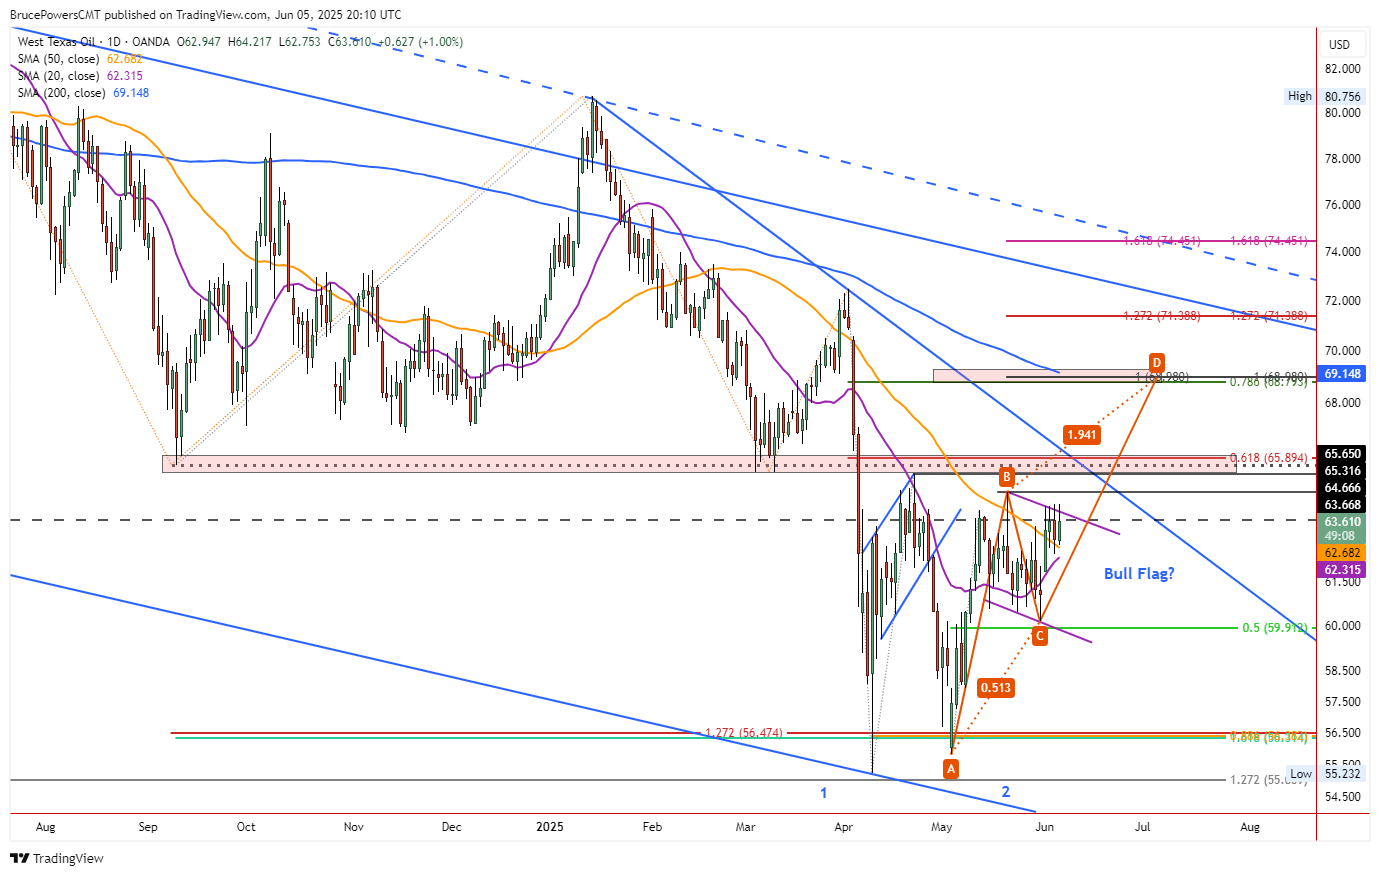
Crude oil continues to push up against a resistance zone around a prior long-term support level from May 2023. The price was $63.67 from a spike low. Notice the highs of each day this week were slightly above that price level, but the daily closing prices were below it. Moreover, the rally following a second low in early May also found resistance around the 2023 support level.
Consolidation Continues Above 50-Day MA
On Thursday, gold again consolidated within a relatively tight range around support of the 50-Day MA. That line was reclaimed on Monday and gold closed above the 50-Day line each day this week. That is a sign of strength, indicating the potential for an upside continuation. However, a signal is needed and that would be provided by a decisive rally above this week’s high of $64.22. Subsequently, a new bullish continuation signal would be generated on a rally above an initial swing high of $64.67 (B) from May 19.
Bull Breakout on Weekly
A bull breakout on the weekly chart triggered on Monday as last week’s high of $53.43 was exceeded. The breakout was confirmed on a daily basis and it will be confirmed on a weekly basis if Friday’s closing price is above that higher. That would be another bullish sign, and on the more significant longer time frame. A confirmed weekly breakout would put crude oil in a good position to challenge the May swing high.
Higher Potential Targets
The first rally from the April trend low found resistance at a high of $65.32. That was around a prior long-term support area. However, that price level should be exceeded if a breakout above the May swing high triggers, as bullish momentum has been building during consolidation. An initial key upside target is the confluence of two price levels. The 78.6% Fibonacci retracement is at $68.79 and a rising ABCD pattern points to $68.98.
There is also the potential for higher targets as there are two potential bullish patterns that could trigger. A potential double bottom reversal pattern would trigger on a rally above the April high of $65.32. Contained within the pattern is a more recent potential bull flag pattern. The flag would trigger on a rise above this week’s high.
For a look at all of today’s economic events, check out our economic calendar.
About the Author
Bruce Powerscontributor
Bruce has been involved in the financial markets for over 20 years, as an analyst, trader, educator, and writer.


Advertisement