
Advertisement
Advertisement
XRP Price News: Ripple Could Retest Key Support After Hitting $2.8
By:
Key Points:
- XRP has dropped by 4.5% in the past week.
- Multiple retests of the token’s 200-day daily EMA may have weakened this important support.
- The price action in lower time frames shows that XRP may be heading to retest this key indicator again.

Tensions between the United States and China on the trade front have spooked investors in the past few days as the two countries have failed to reach a sustainable agreement that both complies with Trump’s pro-Made-in-America agenda and China’s economic goals.
Cryptos needed to cool off after a strong rally pushed Bitcoin (BTC) to a new all-time high. Momentum oscillators like the Relative Strength Index (RSI) had already reached extreme levels before this pullback.
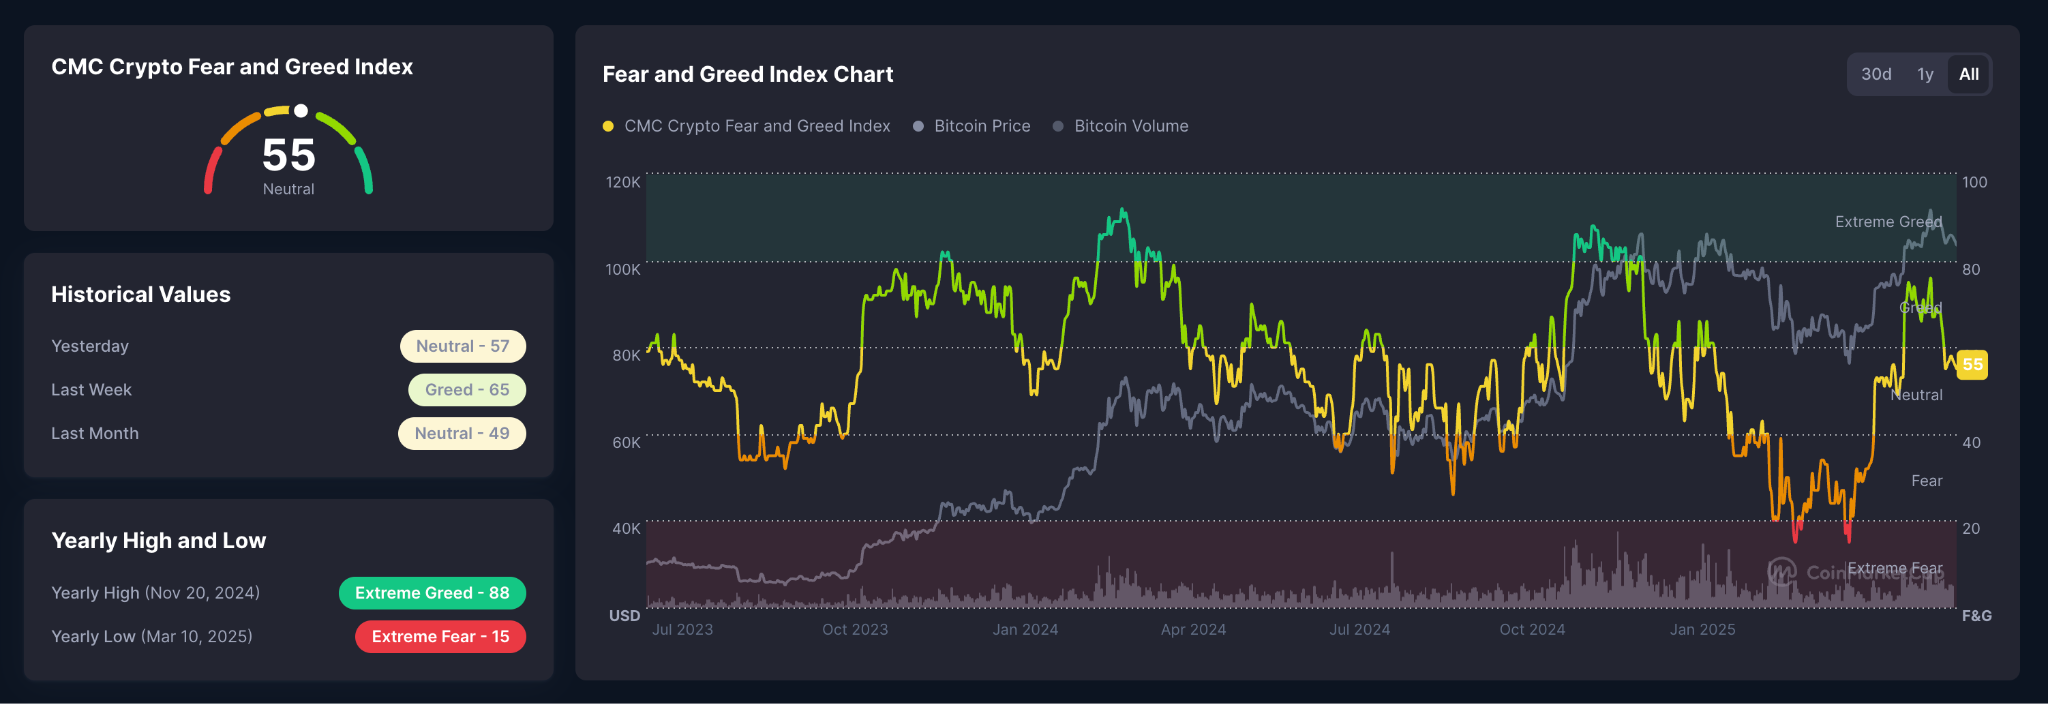
Meanwhile, the Fear and Greed Index has dropped from 76 (Extreme Fear) to 56 lately as investors may have adopted a more cautious approach amid the latest downturn.
XRP’s 200D EMA Has Lost Relevance
The launch of XRP futures by the CME Group and chatter about the upcoming approval of an XRP-linked exchange-traded fund (ETF) by the U.S. Securities and Exchange Commission (SEC) had managed to keep the price of XRP above its 200-day exponential moving average (EMA) in the daily chart.
However, momentum has stalled lately and this key indicator has been touched two times already in the past two months, meaning that, as a support level, it may be losing relevance.
The reason for this is that most of the order blocks that were executed once the price touched this indicator may have been filled already and interest from buyers could have dried up now as a result of the pullback.
When the market is in bullish mode, repeated support touches are not necessarily supportive, especially if the price fails to make a higher high after that tag.
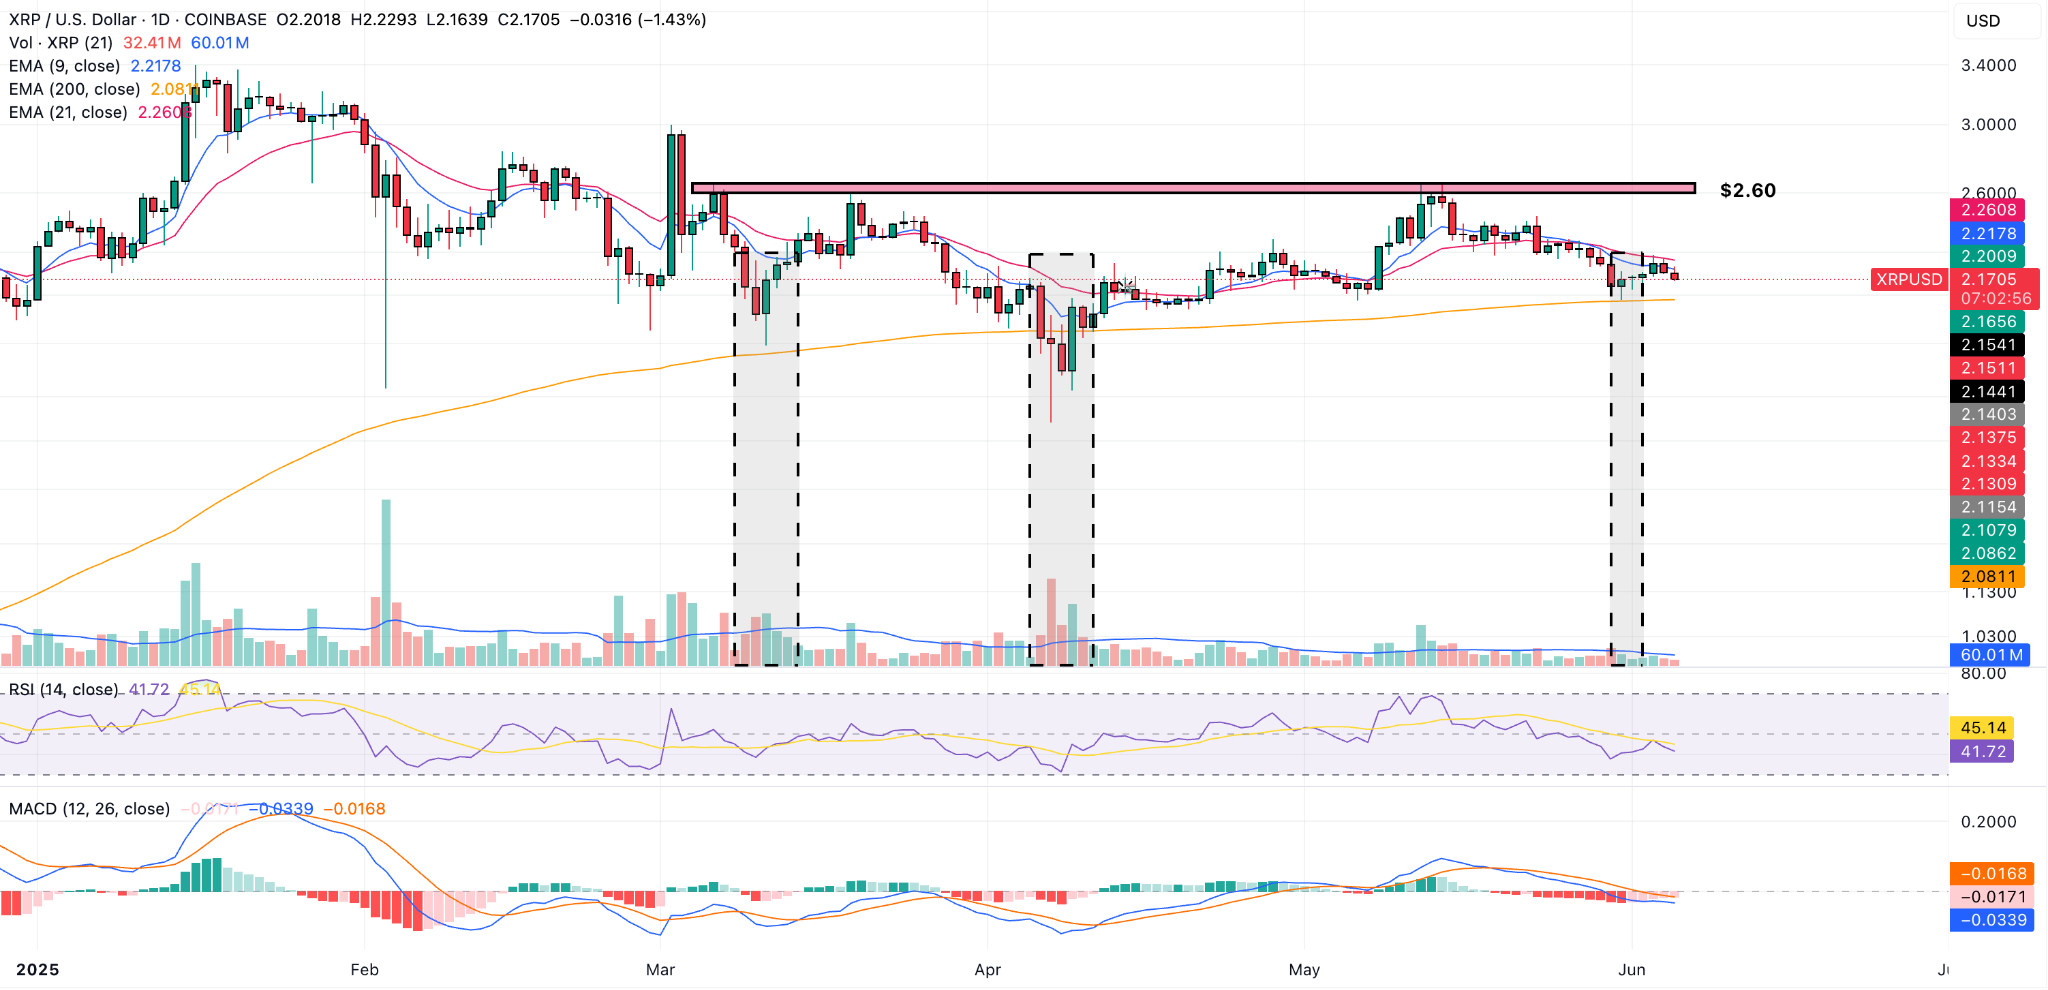
The last time XRP touched the 200-day EMA, it retested the $2.60 level. The price recently retested this indicator once again but notice how trading volumes at that level were below the average. Hence, there wasn’t much buying going on.
The Relative Strength Index (RSI) currently stands at 42, meaning that the downtrend has been gaining strength. In addition, the oscillator has dropped below its 14-day moving average, indicating a change in momentum from bullish to bearish.
Hourly Price Action Supports 200D EMA Retest
Moving to a lower time frame, we can see that the price rejected a move above a former support that has now turned into resistance at $2.28.
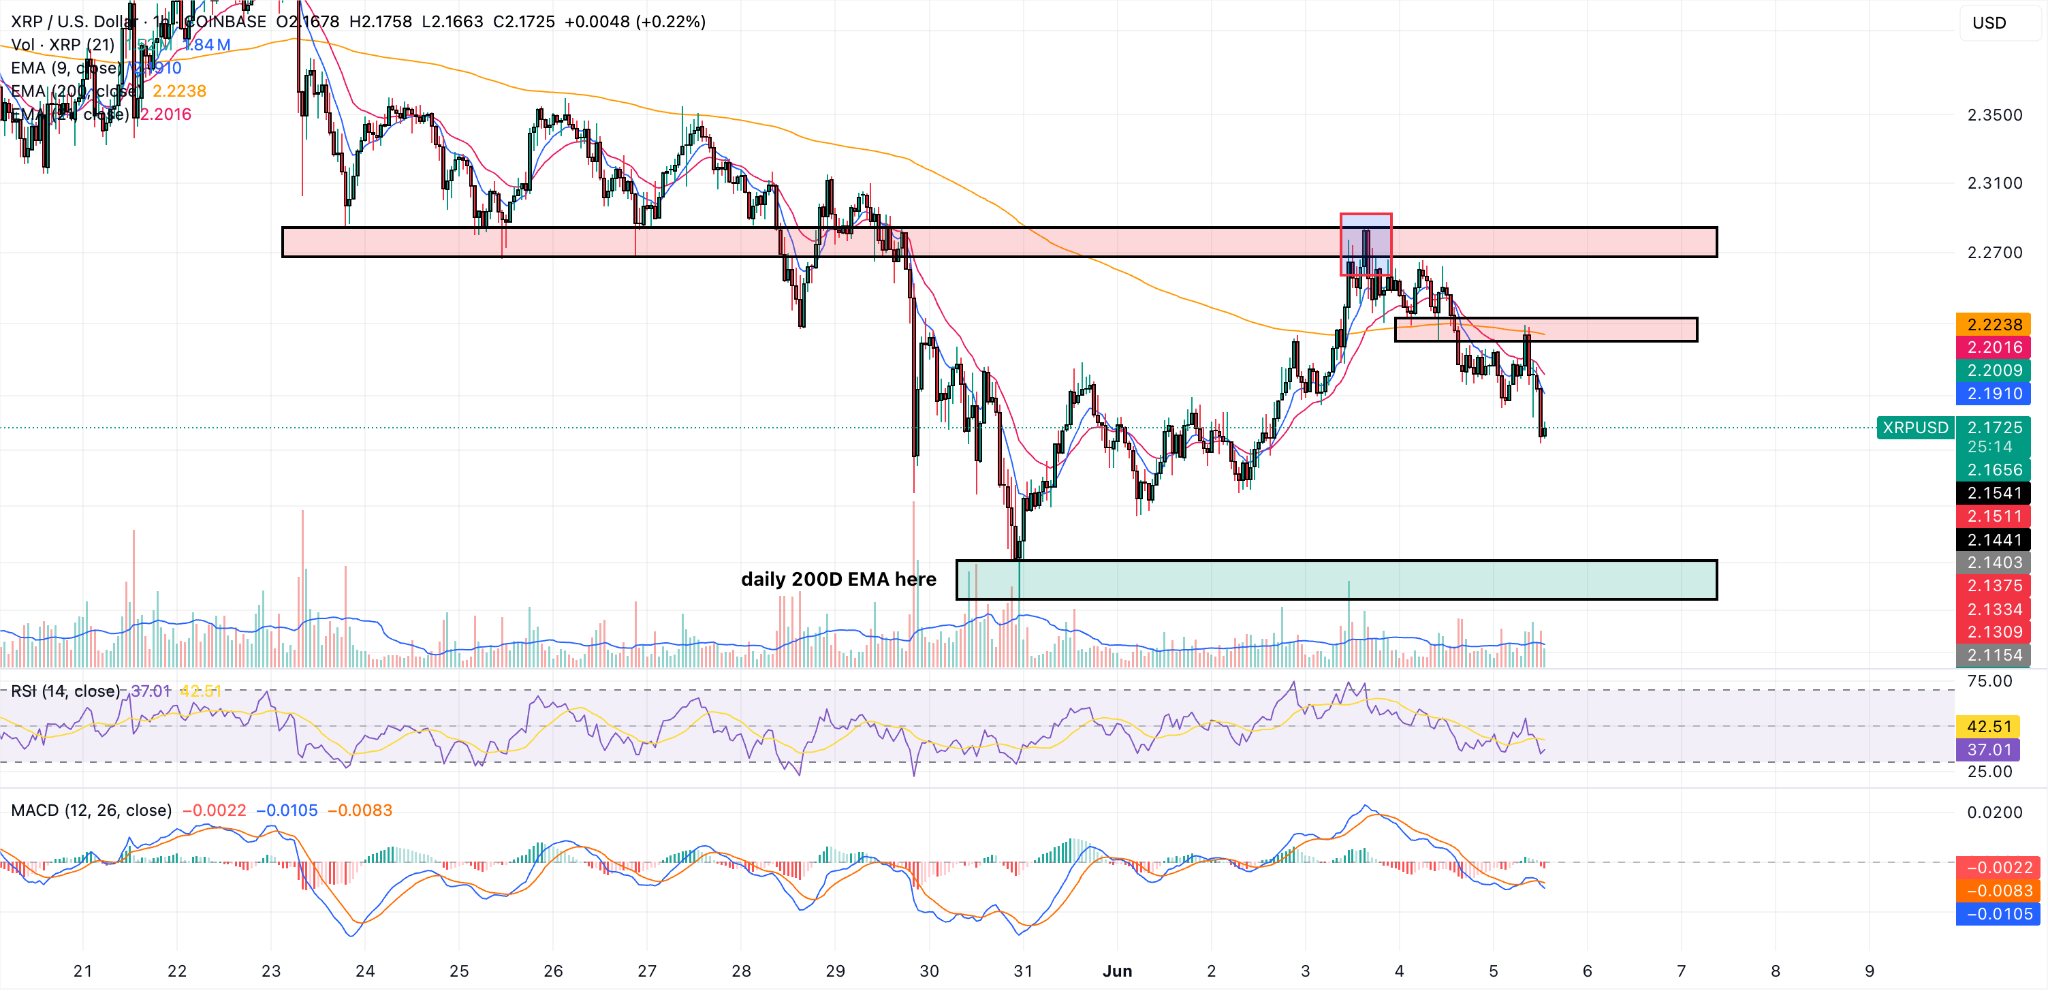
The price is now free-falling and my guess is that the 200-day EMA is the magnet pulling XRP down at this point and that may be where the market is heading next.
Both the 9-period and 21-period EMAs have moved down the 200-hour EMA – a strong sell signal, while momentum indicators are heavily depressed as the Relative Strength Index (RSI) sits at 36.
The downtrend seems strong enough at this point to retest the $2.08 level, which is where the 200-day EMA stands.
Traders could look for good entries at this point if they agree with this bearish outlook and they could use the 200-period EMA of the hourly chart as their stop price.
About the Author
Bob MasonChief Crypto Boss
123456789 30 He has written extensively for a broader audience and his current focus is on developments relating to the financial markets including, but not limited to currencies, commodities, alternative asset classes, and global equities.


Advertisement