
Advertisement
Advertisement
Ethereum Price Prediction: Can a Bear Trap Propel ETH Back to $2,700?
By:
Key Points:
- $250 million worth of ETH longs have been wiped out in the past 24 hours.
- The risk of big drops in an over-leveraged, one-sided market like this is quite high.
- ETH could climb back to $2,700 after a successful bear trap.

The American session just started and this can either exacerbate the downturn or push ETH back to key levels as the price action indicates a potential bear trap.
Nearly $1 billion worth of long positions have been wiped out of the crypto market in the past 24 hours. This is the highest single-day amount on record since late February, back when the market was plummeting fast during the post-Trump-election bear market.
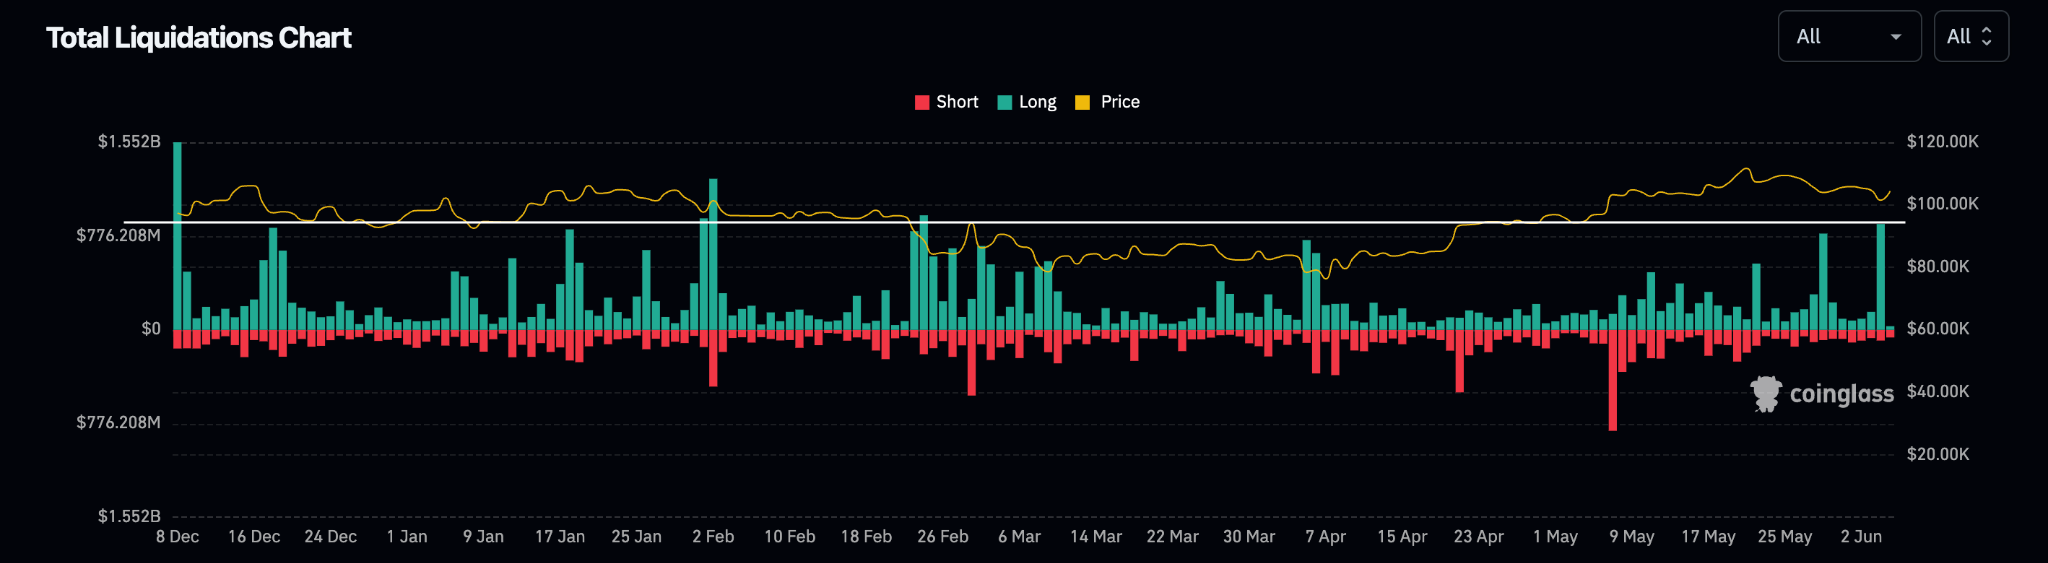
Of that total, $250 million corresponds to ETH longs solely – just $50 million shy of BTC. This emphasizes how leveraged this market is as it is abnormal that a 5% 24-hour decline can inflict so much pain on traders.
Despite the wipe-out, ETHUSDT’s long-short ratio of accounts in Binance currently sits at 2. Although this is still an extreme level that indicates a heavily ‘one-sided’ market that is in desperate need of a correction, the metric has cooled off from a previous high of 2.77 back on May 18.
In a scenario like this, the risk of a strong pullback increases as market makers could aim to balance out their order books by flushing out excess longs. This could trigger a strong long squeeze, especially if certain key levels are hit.
At this point, this could turn into a liquidity quest for market makers to find where most ETH longs stand. If they manage to press the right keys, they could trigger a sizable correction by blowing up a ton of long orders.
ETH Enters Consolidation After Strong Uptrend
Ethereum has clearly entered a stage of consolidation as the market needs a pause after the latest rally to determine where it should be heading next.
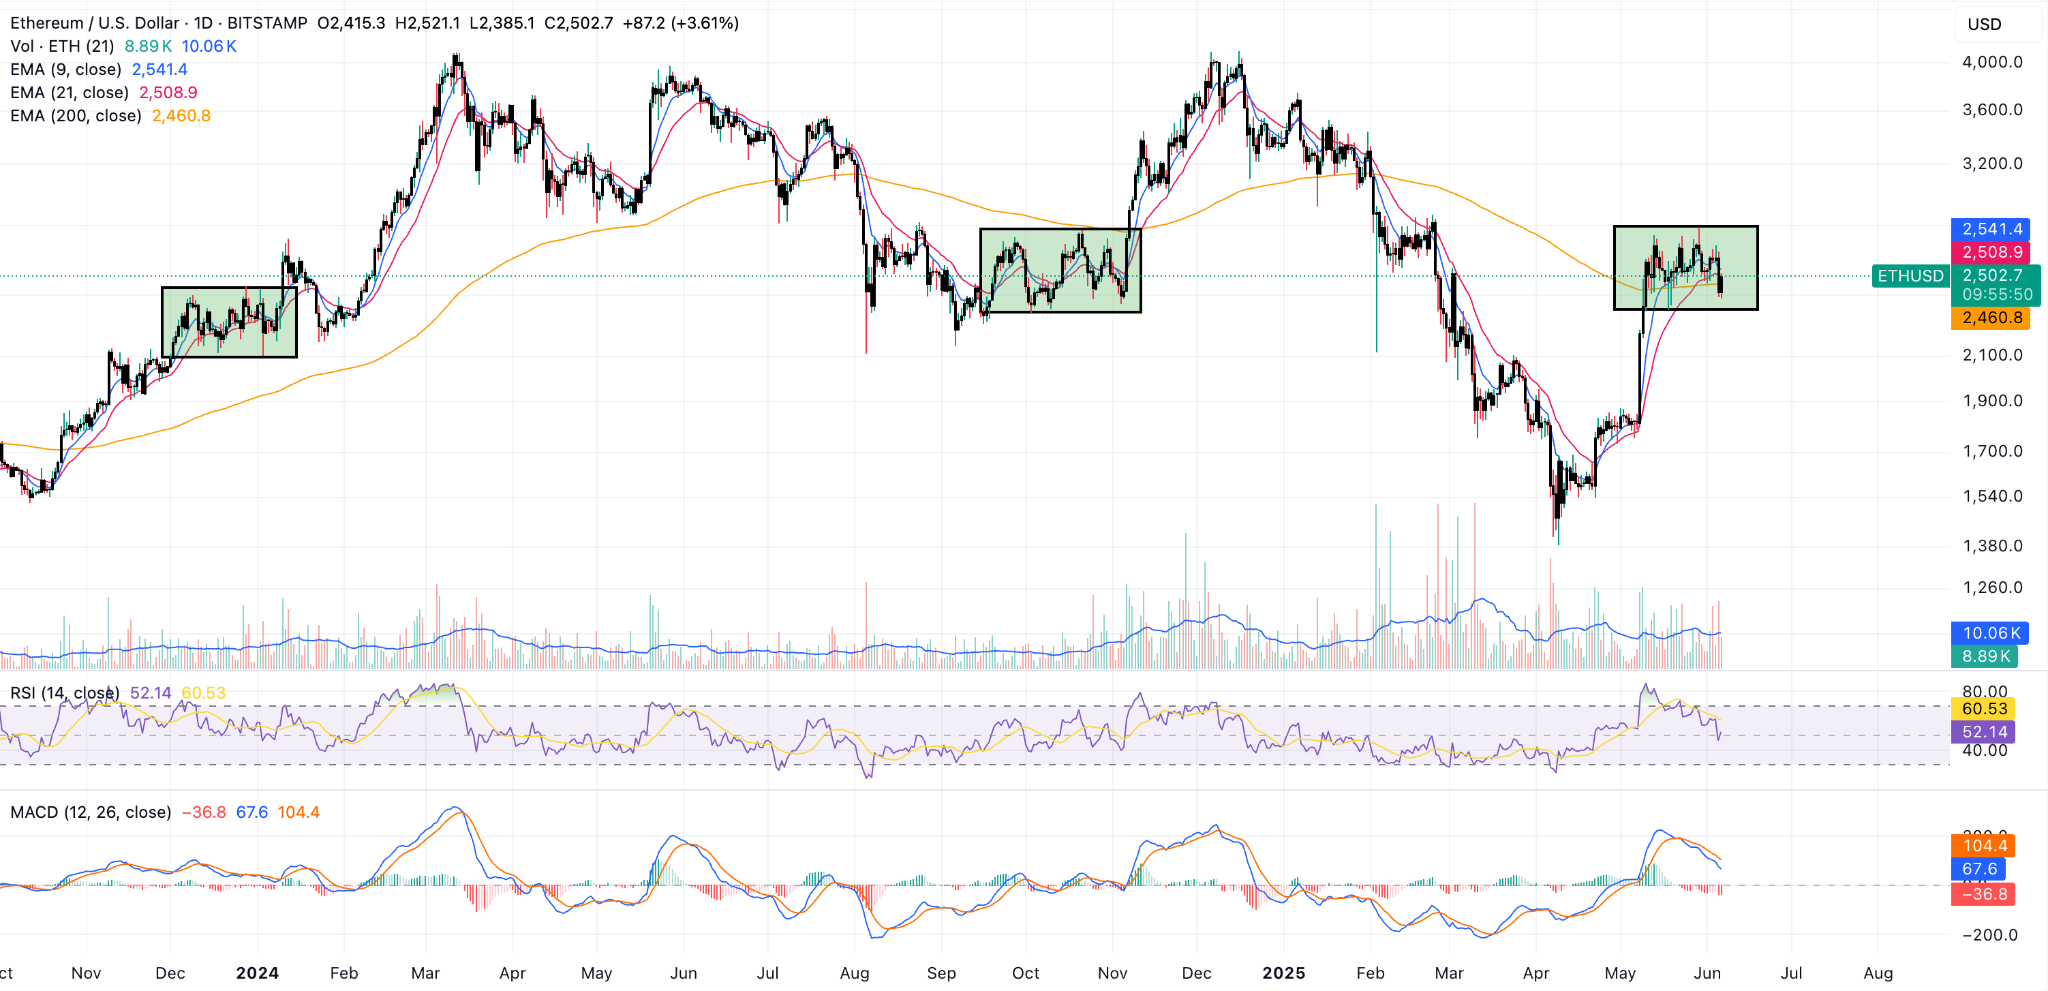
The Pectra upgrade and a sentiment shift in the market from Extreme Fear to Greed in record time support a bullish outlook for ETH.
However, tensions between the United States and China on the trade front and the impact that failed negotiations could have on the U.S. economy and the overall macroeconomic backdrop have weighed on investors lately.
Consolidation patterns are unbiased. However, they are quite powerful in determining the next trend’s direction.
A bearish or bullish breakout will determine what the market has decided after a brief period of accumulation. They can either keep buying if a new bullish catalyst pops up or they can be net sellers if macroeconomic conditions worsen.
Bear Trap Could Result in Big Spike to $2,700
Heading to the lower time frames, we can see a couple of key levels that traders should keep an eye on in the next few hours (or days).
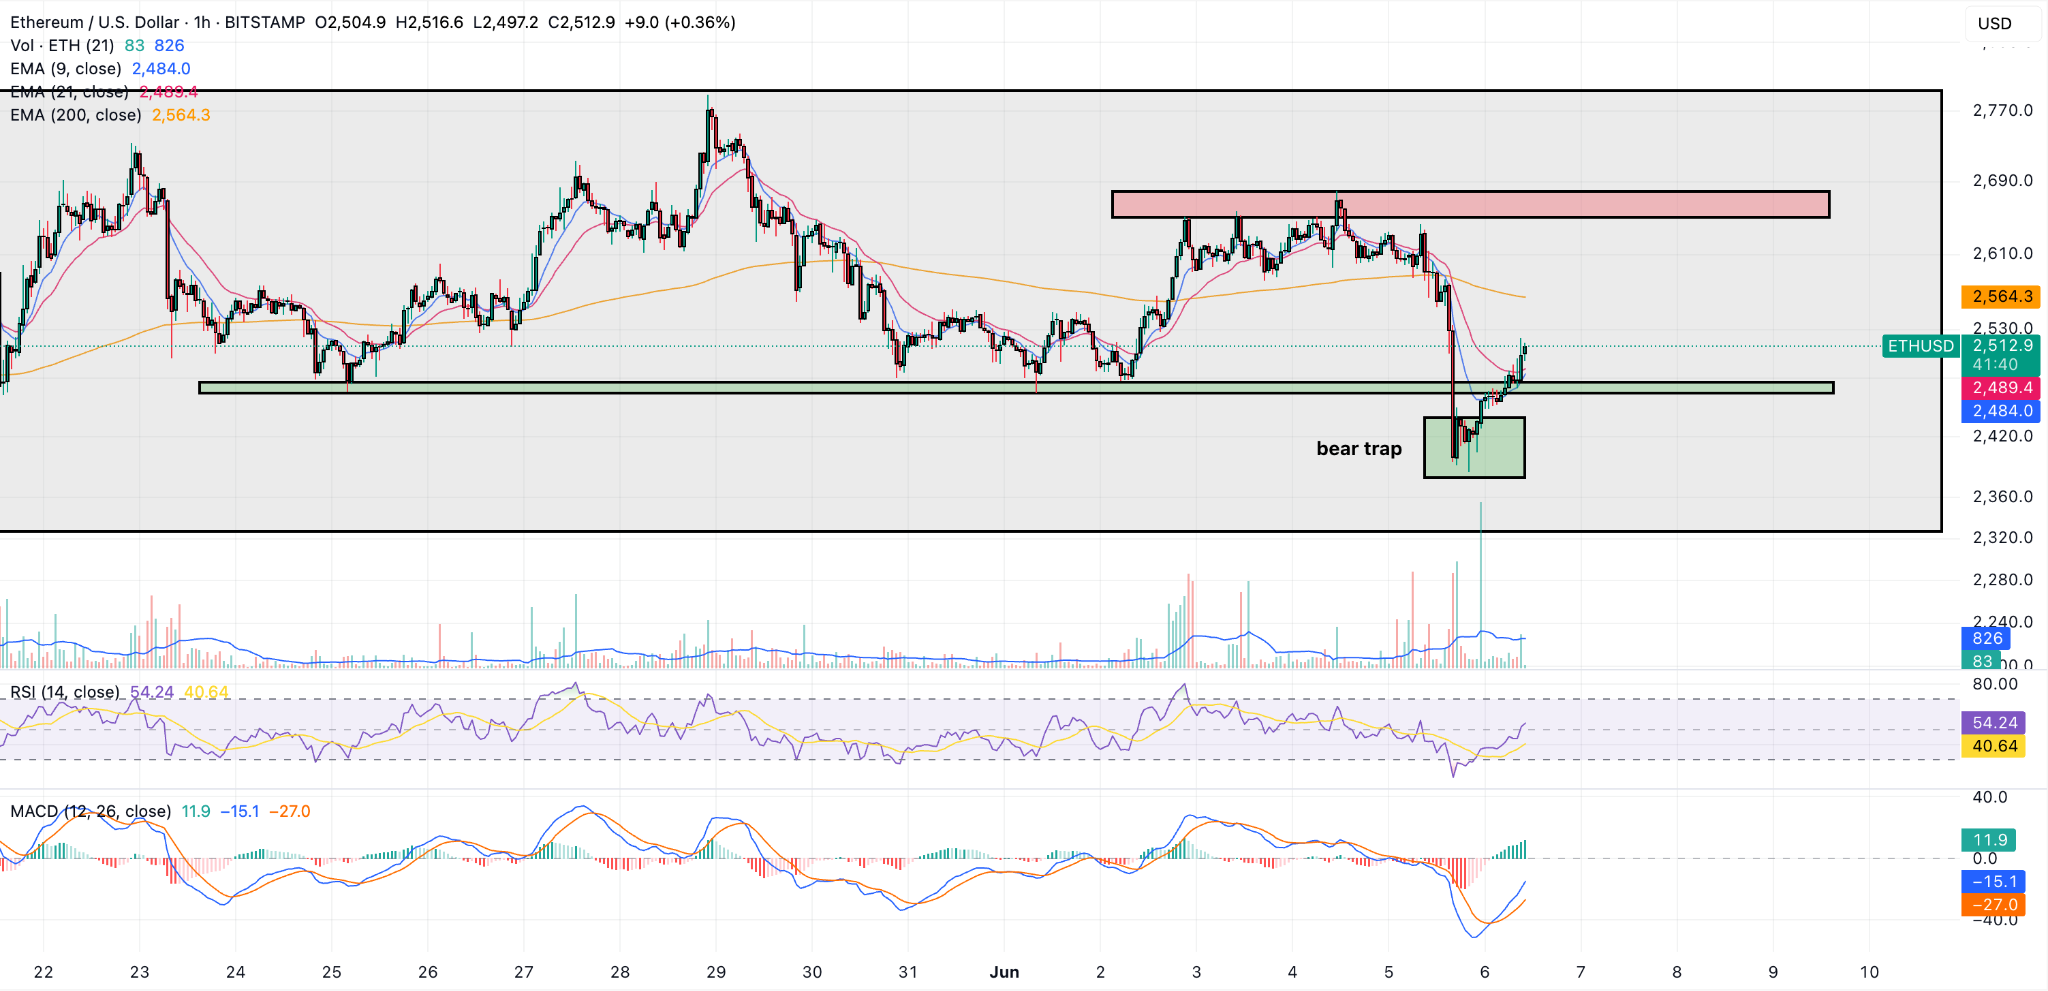
The first thing that pops up is a bear trap. A decline below the $2,450 level prompted a wave of selling, possibly as a significant number of long orders were blown up in the process – which explains why liquidations spiked in the past 24 hours.
However, this decline was met with strong buying pressure once ETH dropped to $2,400 – which is a key psychological support.
This order block is an important one to watch. However, the trend has not been reversed yet as ETH would have to rise above the $2,600 level to pull that off.
If this bear trap managed to raise the necessary liquidity to push ETH above that level – which coincides with the token’s 200-period EMA in the hourly chart – this could trigger a sizable uptrend that pushes ETH back to around $2,700.
About the Author
Bob MasonChief Crypto Boss
123456789 30 He has written extensively for a broader audience and his current focus is on developments relating to the financial markets including, but not limited to currencies, commodities, alternative asset classes, and global equities.


Advertisement