
Advertisement
Advertisement
U.S. Dollar Slides as Tariff Tensions Flare: Analysis For EUR/USD, GBP/USD
By:
Key Points:
- DXY hovers near 98.85 as traders await ISM PMI, with trade tensions and geopolitical risks weighing.
- Trump's steel tariff hike plan to 50% reignites trade war concerns and adds market uncertainty.
- US-China trade truce crumbles as non-tariff barriers emerge, heightening global trade friction.

Market Overview
During early European trade, the US Dollar Index (DXY) hovered around 98.85, as traders awaited the May ISM Manufacturing PMI report for cues. The dollar lost momentum amid rising trade policy uncertainty and geopolitical tensions, keeping markets cautious.
Tariff Hikes and Legal Disputes Shake Confidence
The greenback struggled as former President Donald Trump proposed doubling steel import tariffs from 25% to 50% at a rally in Pennsylvania. He argued that the move would bolster US steel production and reduce dependence on foreign suppliers, amplifying concerns over renewed trade friction ahead of the US elections.
Meanwhile, a Manhattan federal court ruled that Trump’s earlier import tariffs exceeded executive powers, halting the “Liberation Day” tariffs. However, a US Court of Appeals temporarily reversed this decision, allowing the tariffs to proceed while legal battles continue, deepening uncertainty around future US trade policy.
US-China Trade Tensions Resurface
Tensions between Washington and Beijing resurfaced after Trump accused China of violating a recently agreed tariff truce. US Trade Representative Jamieson Greer echoed these concerns, citing issues over non-tariff barriers.
This renewed friction is raising investor caution and complicating the Federal Reserve’s monetary policy outlook, as markets weigh the economic risks of sustained trade disruptions.
US Dollar Index (DXY) – Technical Analysis
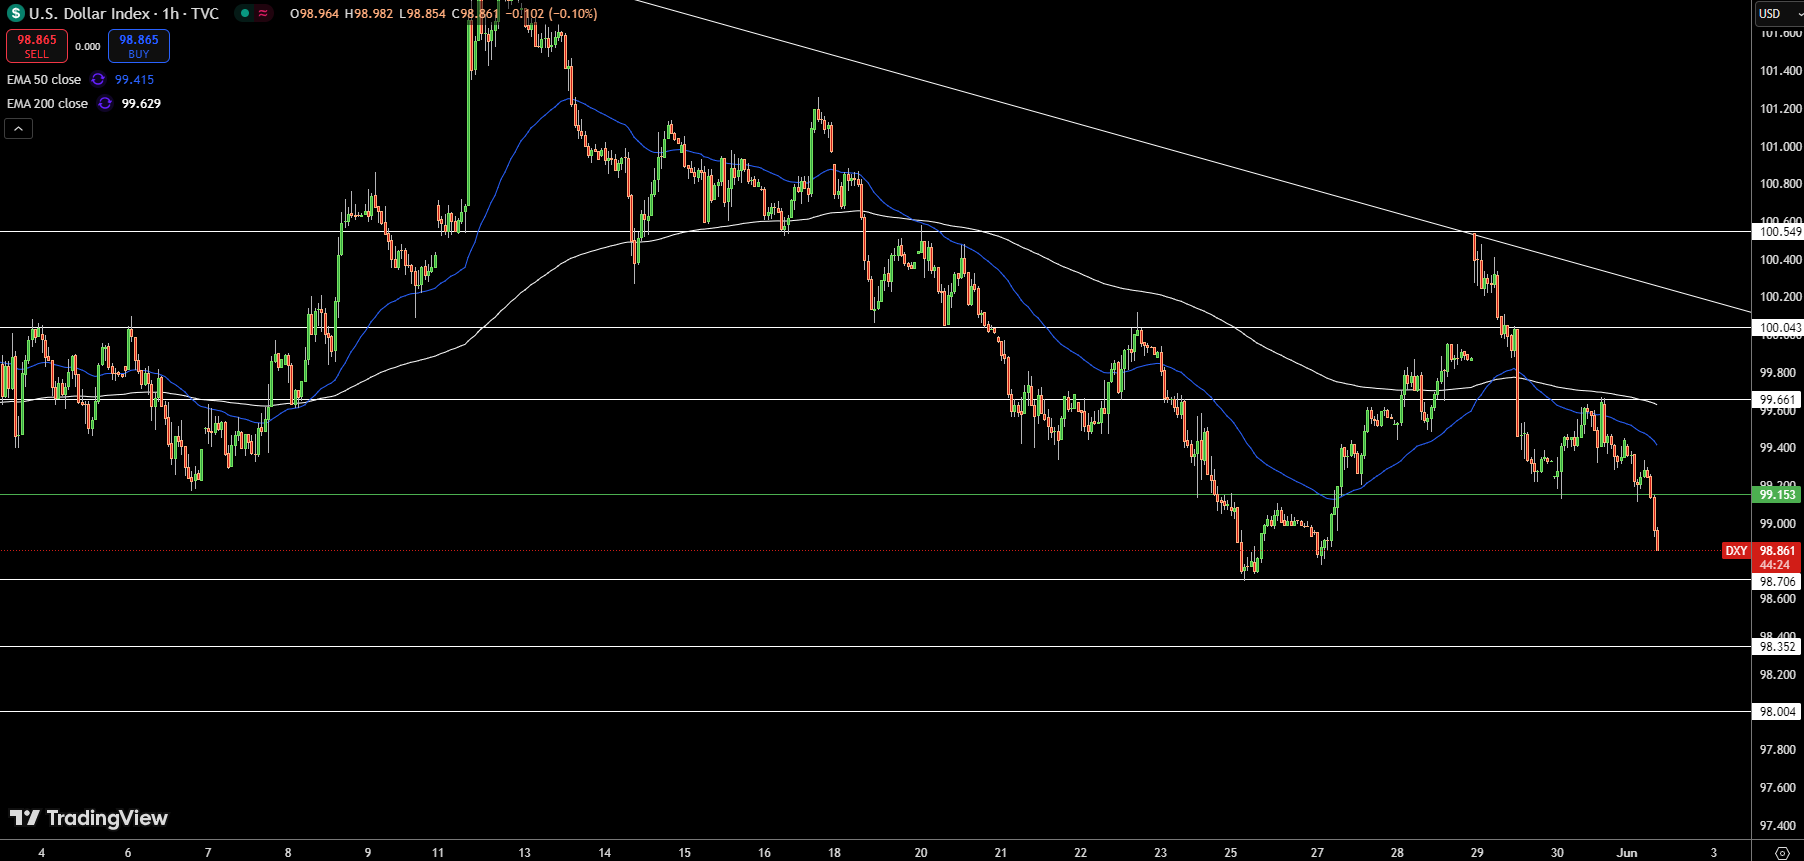
The $DXY is under sustained downward pressure, trading near 98.86 as sellers remain in control. On the 1-hour chart, the index has decisively broken below key support at 99.15, which had previously provided a buffer. The 50-period EMA ($99.42) has flipped from dynamic support to resistance, with the 200-period EMA ($99.62) reinforcing overhead barriers.
Price action confirms a bearish bias, marked by lower highs and lower lows beneath a descending trendline. Key support levels are 98.35 and 98.00, where buyers may step in. If selling pressure intensifies, a drop toward 97.50 or 97.00 is possible.
A recovery above 99.15 could signal a temporary bounce toward 99.60–100.04, though the broader downtrend remains intact unless a strong bullish reversal pattern emerges.
GBP/USD Technical Analysis
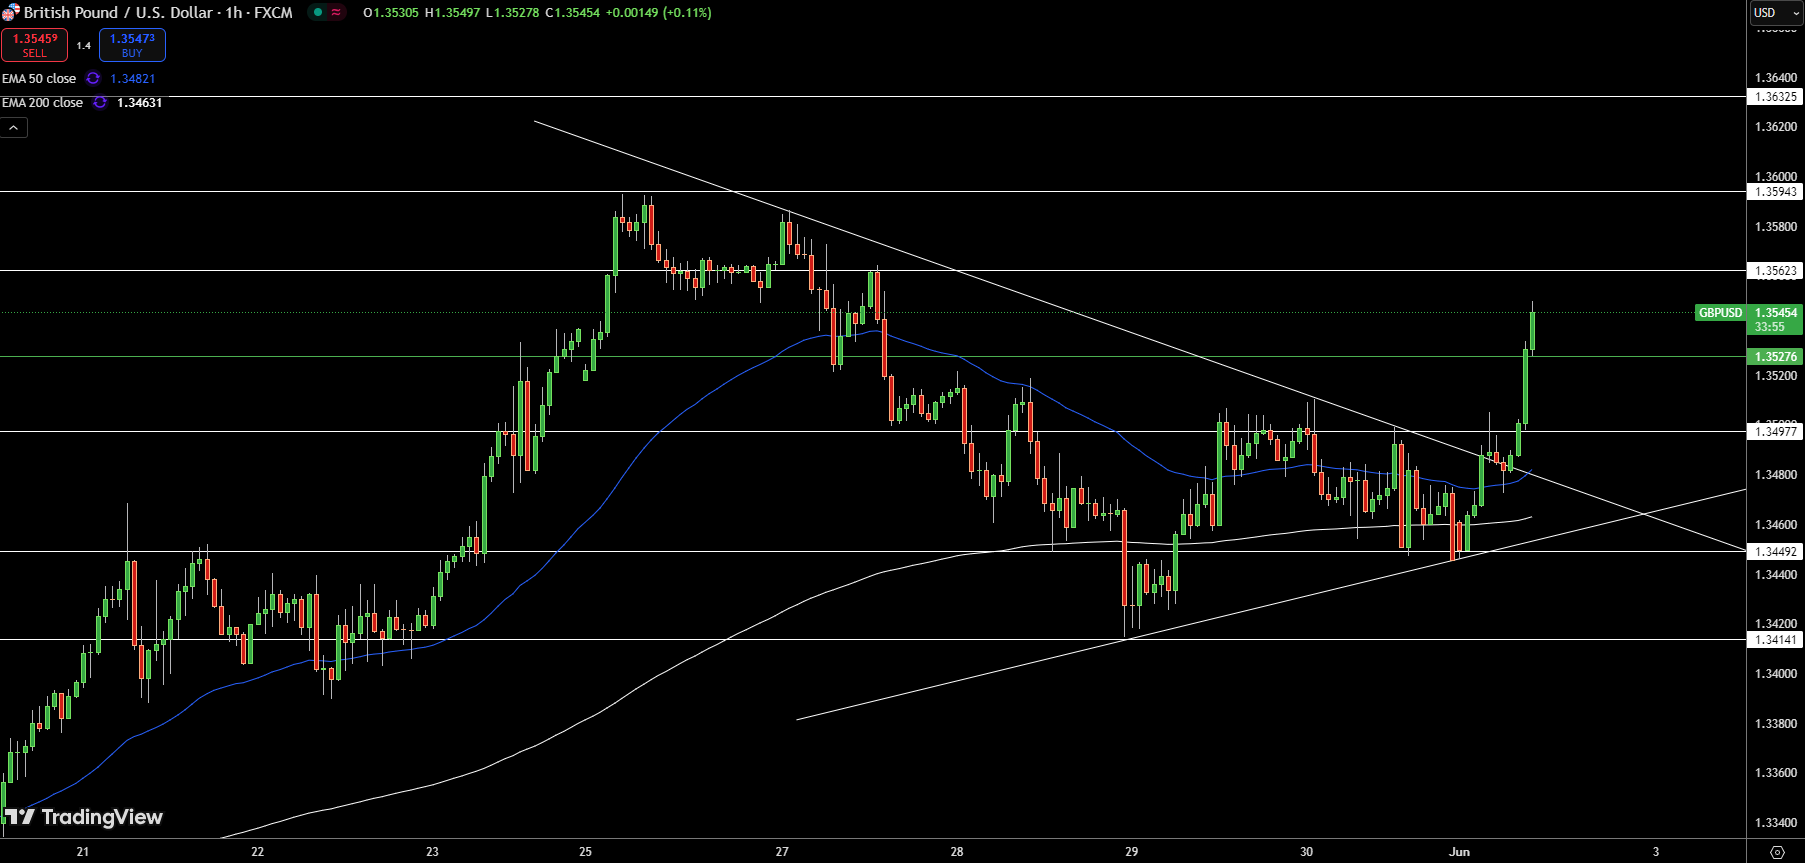
GBP/USD broke decisively above the descending trendline, surging past $1.3527 and reaching a high near $1.3545. On the 1-hour chart, a sharp bullish candlestick confirmed the breakout through multiple resistance levels. The 50-period EMA ($1.3482) and 200-period EMA ($1.3463) now serve as dynamic support.
Key levels include support at $1.3527 and $1.3498, and resistance at $1.3562 and $1.3594. Sustained buying above $1.3545 could drive gains toward $1.3623. A failure to hold above $1.3527 may lead to a pullback toward $1.3498 or $1.3463, though the bullish breakout suggests further upside potential.
EUR/USD Technical Forecast
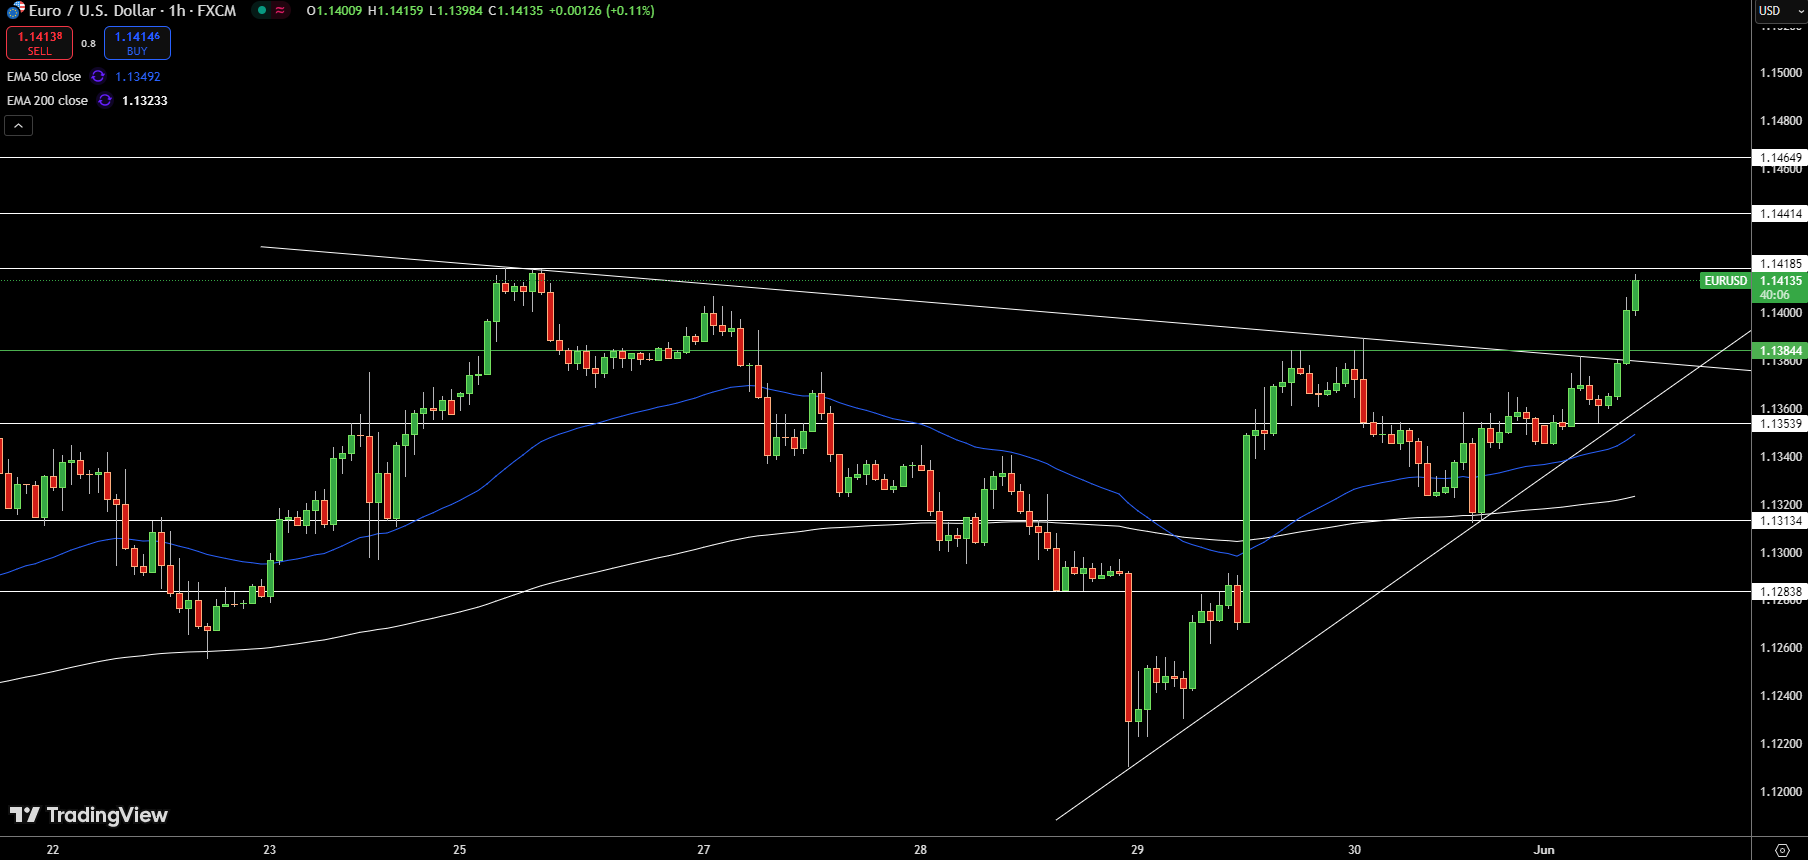
The EUR/USD surged past the descending trendline, confirming a breakout above $1.1384. On the 1-hour chart, buyers are pushing higher toward resistance at $1.1464, supported by a sequence of higher lows and higher highs. The 50-period EMA ($1.1349) and 200-period EMA ($1.1323) provide dynamic support.
Immediate support is at $1.1384, with a deeper floor at $1.1354. If momentum holds, the pair could climb to $1.1464 or $1.1500. A failure to hold above $1.1384 may result in a retest of $1.1354 or lower, though the prevailing bias remains bullish.
About the Author
Bob MasonChief Crypto Boss
123456789 30 He has written extensively for a broader audience and his current focus is on developments relating to the financial markets including, but not limited to currencies, commodities, alternative asset classes, and global equities.


Advertisement