
Advertisement
Advertisement
Silver (XAG) Forecast: Divergence from Gold Deepens—Is Silver Going Up or Breaking Down?
By:
Key Points:
- Silver's four-day decline highlights its industrial exposure as gold benefits from safe-haven demand.
- Price prediction hinges on holding $34.87 support; a break lower could trigger selling toward $33.10.
- Silver slips from a 13-year high, closing at $36.31 as gold rallies on Middle East tensions and Fed rate cut speculation.

Silver Pauses Below 13-Year High as Gold Surge Highlights Divergence
Silver ended the week on a softer note, underperforming gold as geopolitical tensions and monetary policy signals drew investors into traditional safe havens. Silver (XAG/USD) closed Friday near $36.31, down 0.13%, after retreating from Tuesday’s 13-year high of $36.89. The pullback marks silver’s fourth consecutive daily decline, revealing pressure at key technical levels.
Why Is Silver Lagging While Gold Climbs?
The divergence between silver and gold reflects their differing roles in the financial system. While gold surged to multi-week highs on the back of renewed Israel-Iran conflict and soft U.S. inflation data, silver came under pressure. Traders flocked to gold as Iranian retaliation against Israeli strikes rattled markets, but silver—due to its dual identity as both a precious and industrial metal—did not receive the same safe-haven flows.
Silver’s tighter connection to industrial demand, particularly in manufacturing and green energy sectors, makes it more vulnerable during periods of economic uncertainty. While gold responded to Fed rate cut bets and geopolitical stress, silver faced headwinds from firmer Treasury yields and a stronger dollar. The dollar index climbed to 98.33 on Friday, dulling silver’s appeal for non-U.S. buyers.
Technical Levels: Bulls Need to Reclaim $36.89
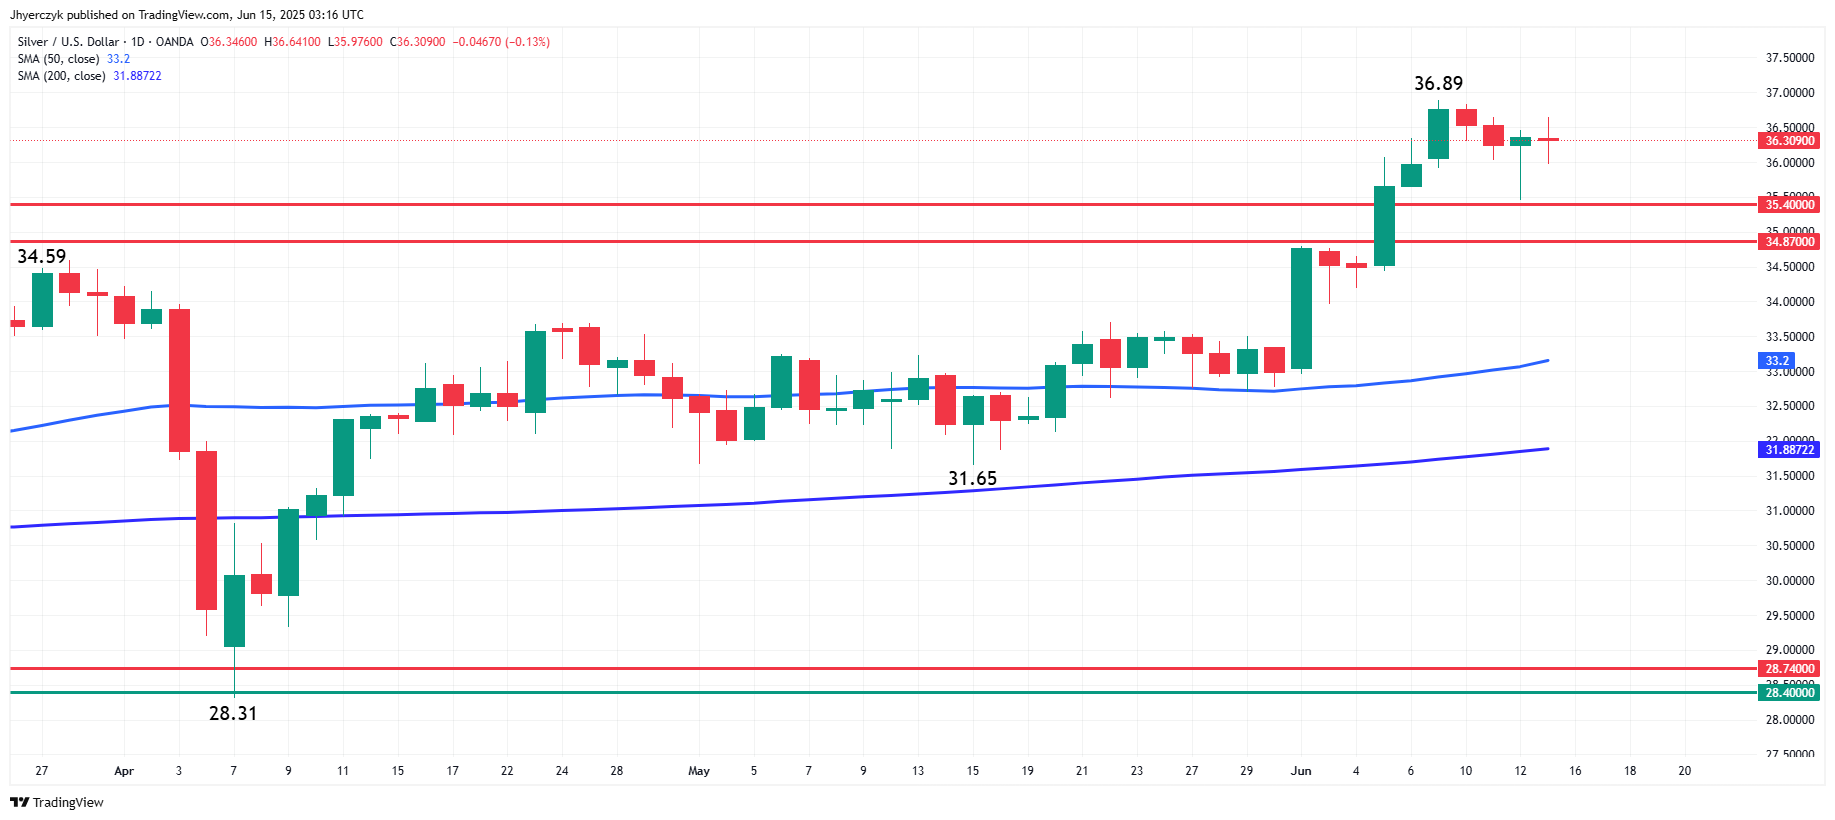
Technically, silver is at a critical juncture. Prices are holding above layered support at $35.40 and $34.87, both of which are previous tops. A clean break below $34.87 would expose the 50-day moving average at $33.20. On the upside, only a move through $36.89 would confirm a bullish continuation pattern. Until then, traders should expect range-bound action.
Fed Policy and the Dollar: Crosscurrents to Monitor
Silver’s struggle also stems from shifting monetary policy expectations. While soft CPI and PPI prints strengthened the case for Fed rate cuts—supportive for non-yielding assets—the accompanying bounce in Treasury yields and the U.S. dollar is a headwind for silver. The same dollar rally that failed to cap gold’s rise has added pressure to silver, which remains more sensitive to financial conditions and real yields.
Outlook: Break or Fade at Key Levels?
Silver’s near-term direction hinges on whether bulls can defend support near $35.00 and make another attempt at the $36.89 high. A break lower could attract momentum sellers toward the $33 handle, while a sustained push above resistance would shift sentiment bullish. Until a clearer technical signal emerges, traders should stay alert to gold price trends, dollar strength, and signs of industrial demand recovery.
More Information in our Economic Calendar.
About the Author
James HyerczykProfits & Punchlines
Mr.Hyerczyk is a technical analyst, market researcher, educator and trader. Jim is an expert in the area of patterns, price and time analysis, Forex and stocks.


Advertisement