
Advertisement
Advertisement
Oil and Natural Gas Rally on Geopolitical Risks as US Dollar Drops
By:
Key Points:
- WTI Crude Oil (CL) surged amid the Iran-Israel conflict.
- Natural Gas (NG) is building positive price action above $3.00.
- US Dollar Index (DXY) remains under bearish pressure below 100.50.

WTI crude oil (CL) extended its rally to around $70.60 during Tuesday’s Asian session. Prices surged to $77 last week due to heightened geopolitical risk following Israel’s attack on Iran. A correction was developed on Monday after reports of significant damage to Iran’s uranium enrichment facility. These developments have raised concerns about a broader regional conflict. The ongoing tensions may trigger strong volatility in the energy sector and could push oil prices even higher.
Oil prices also found support from remarks by a senior Iranian commander, who stated that Iran may close the Strait of Hormuz. This narrow passage handles nearly 20% of the world’s oil shipments. Any disruption could drive oil prices sharply higher. Market participants remain cautious, as the risk of supply disruption continues to support bullish sentiment in crude.
However, a resolution to the conflict may limit the upside in oil prices. President Trump mentioned that Iran is open to talks aimed at de-escalating the situation. This statement has helped ease fears of a prolonged conflict. Traders now await US Retail Sales data, due later on Tuesday. A strong reading could boost the US dollar and weigh on oil prices in the short term.
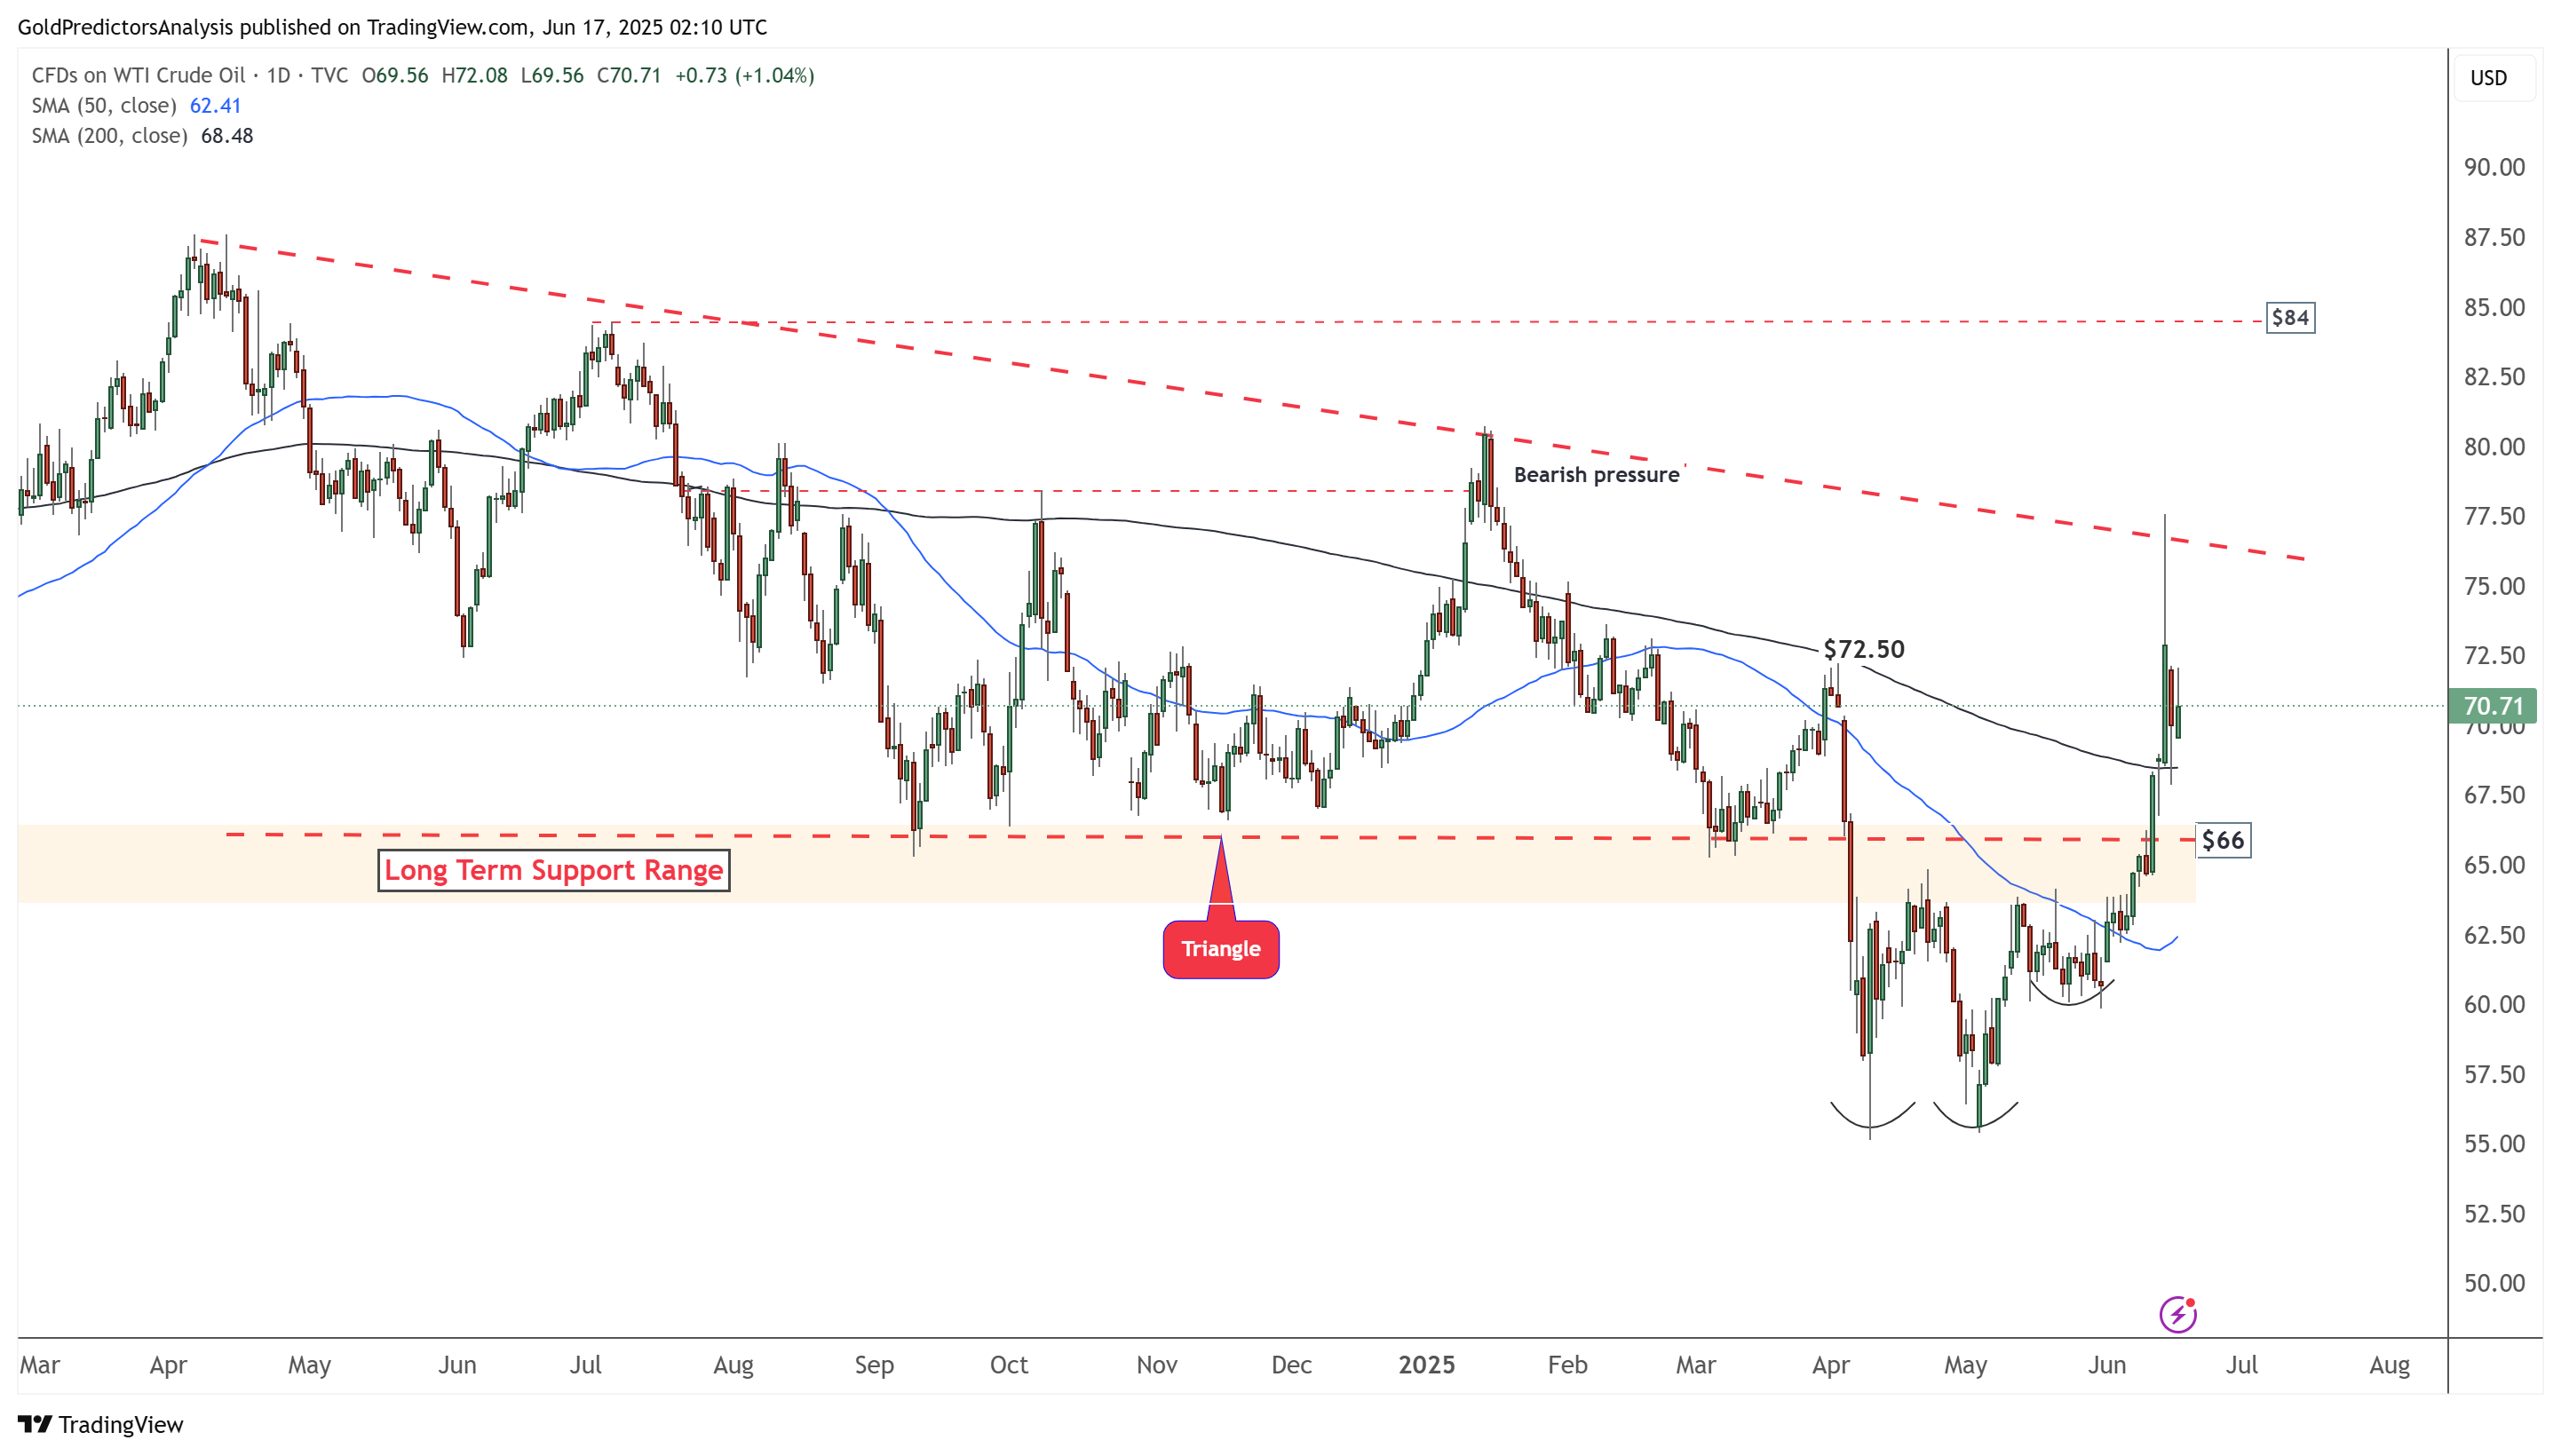
WTI Crude Oil (CL) Technical Analysis
WTI Oil Daily Chart – Break of 200-Day SMA
The daily chart for WTI crude oil indicates that the price has broken above the 200-day SMA, initiating bullish momentum toward the resistance marked by the red-dotted trendline. A break above $77.50 could trigger a move toward the $84 area. The formation of a double bottom near $55, followed by a breakout above the 200-day SMA, indicates further upside potential in crude oil.
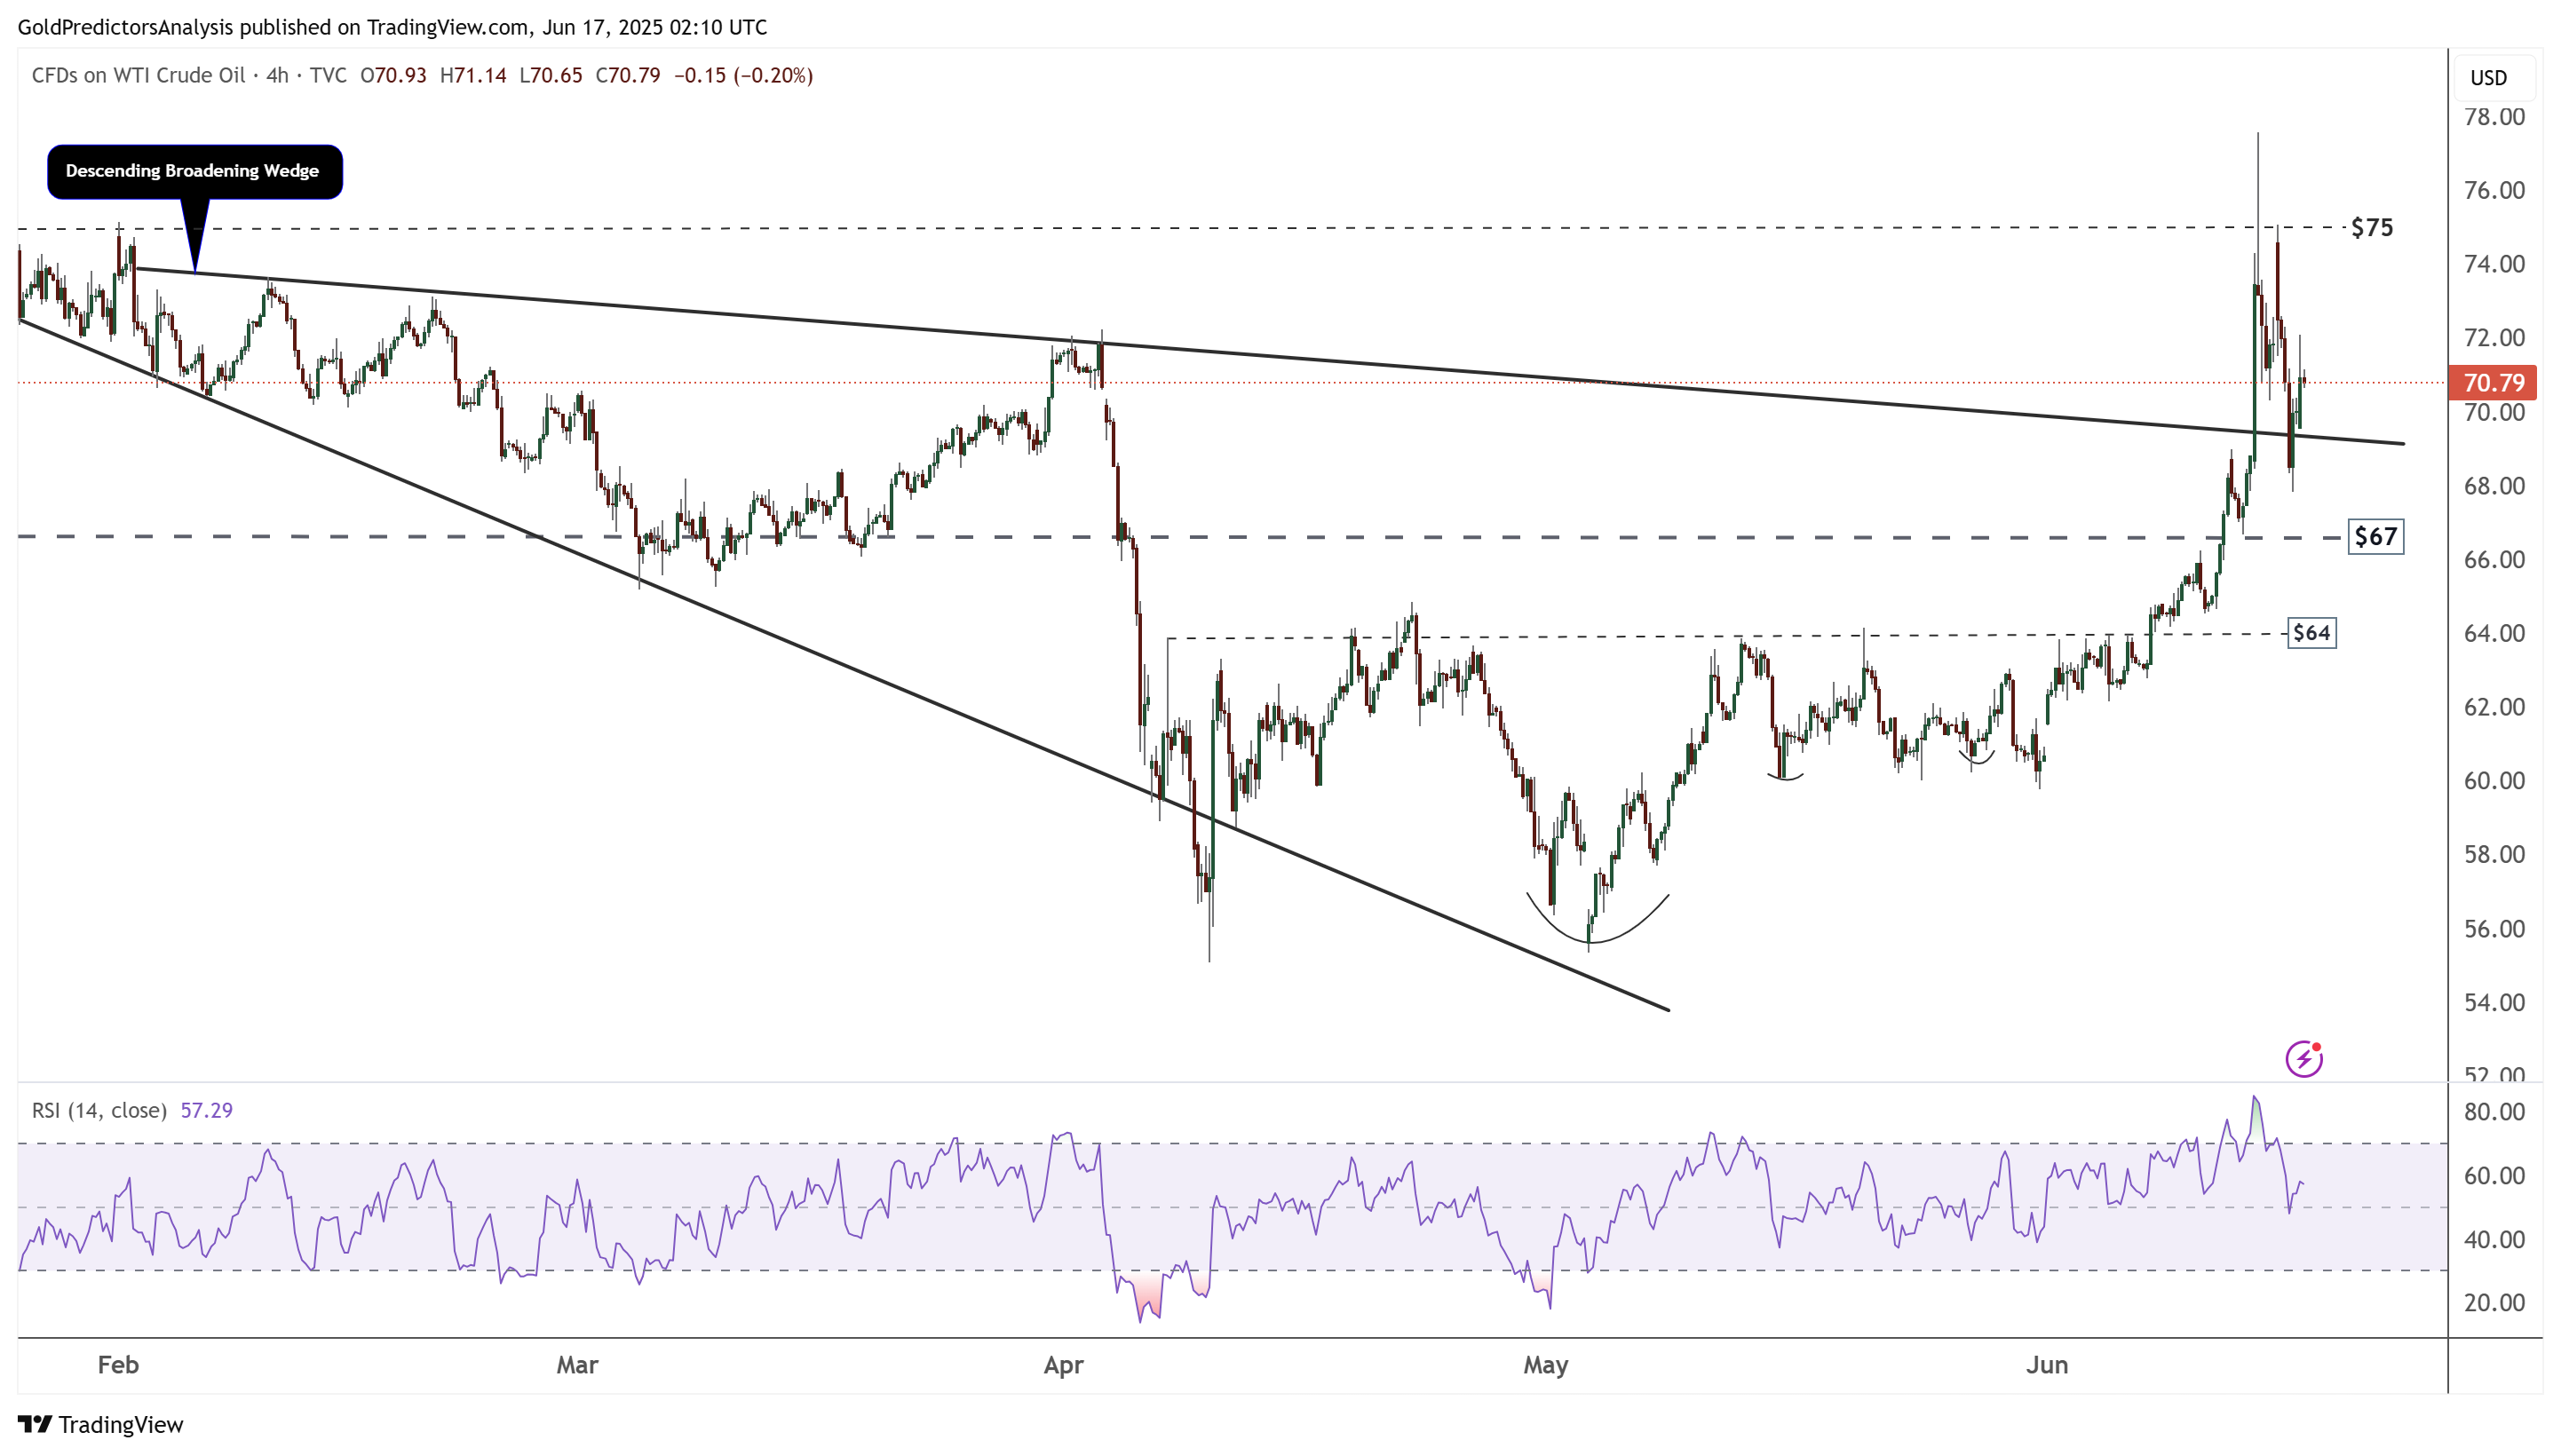
WTI Oil 4-Hour Chart – Break of Descending Broadening Wedge
The 4-hour chart for WTI crude oil shows that the price has broken out of a descending broadening wedge pattern, initiating positive momentum toward the $75 area. A bottom has formed around the $55 level, and the overall structure remains bullish. The RSI indicates that the correction from $77 found support near $68, suggesting the price may continue to rally higher.
Natural Gas (NG) Technical Analysis
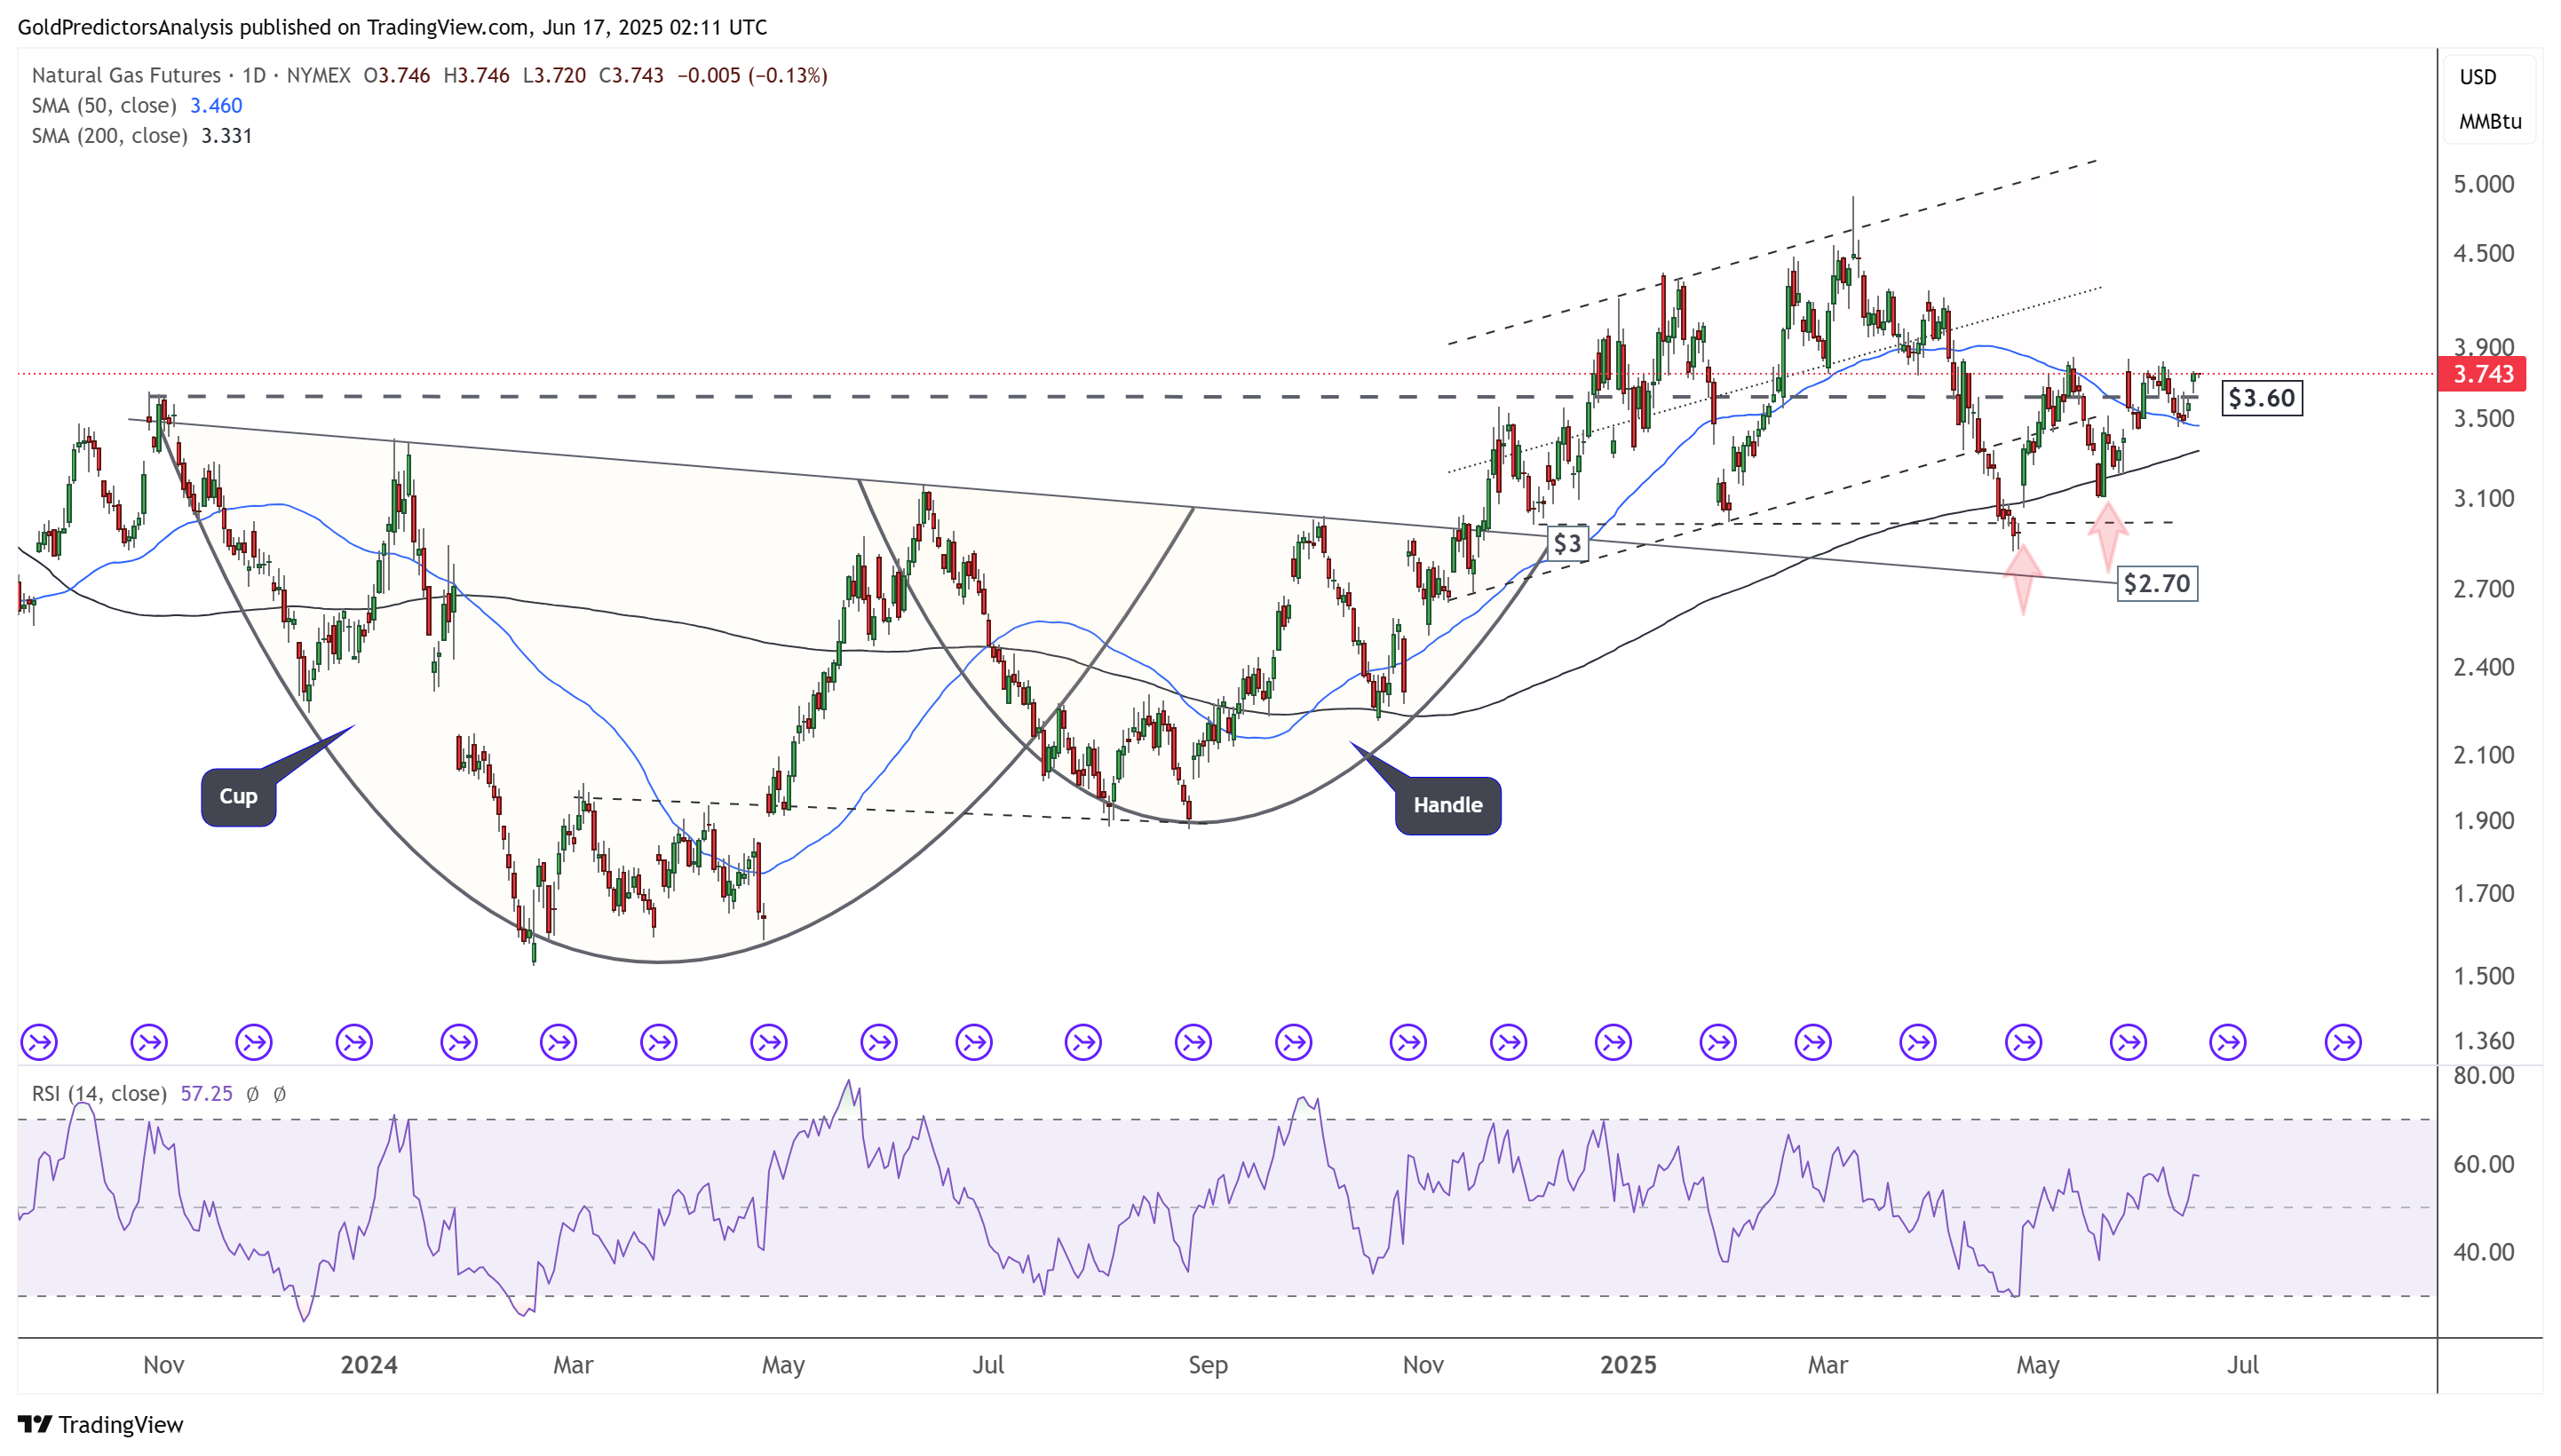
Natural Gas Daily Chart – Key Level of $3
The daily chart for natural gas (NG) indicates that the price is forming a bullish price structure within an ascending channel after breaking out of a cup-and-handle pattern. As long as the price remains above the $3 support level, it is likely to continue toward the $5 area. Moreover, the RSI is rebounding from the mid-level, indicating positive momentum.
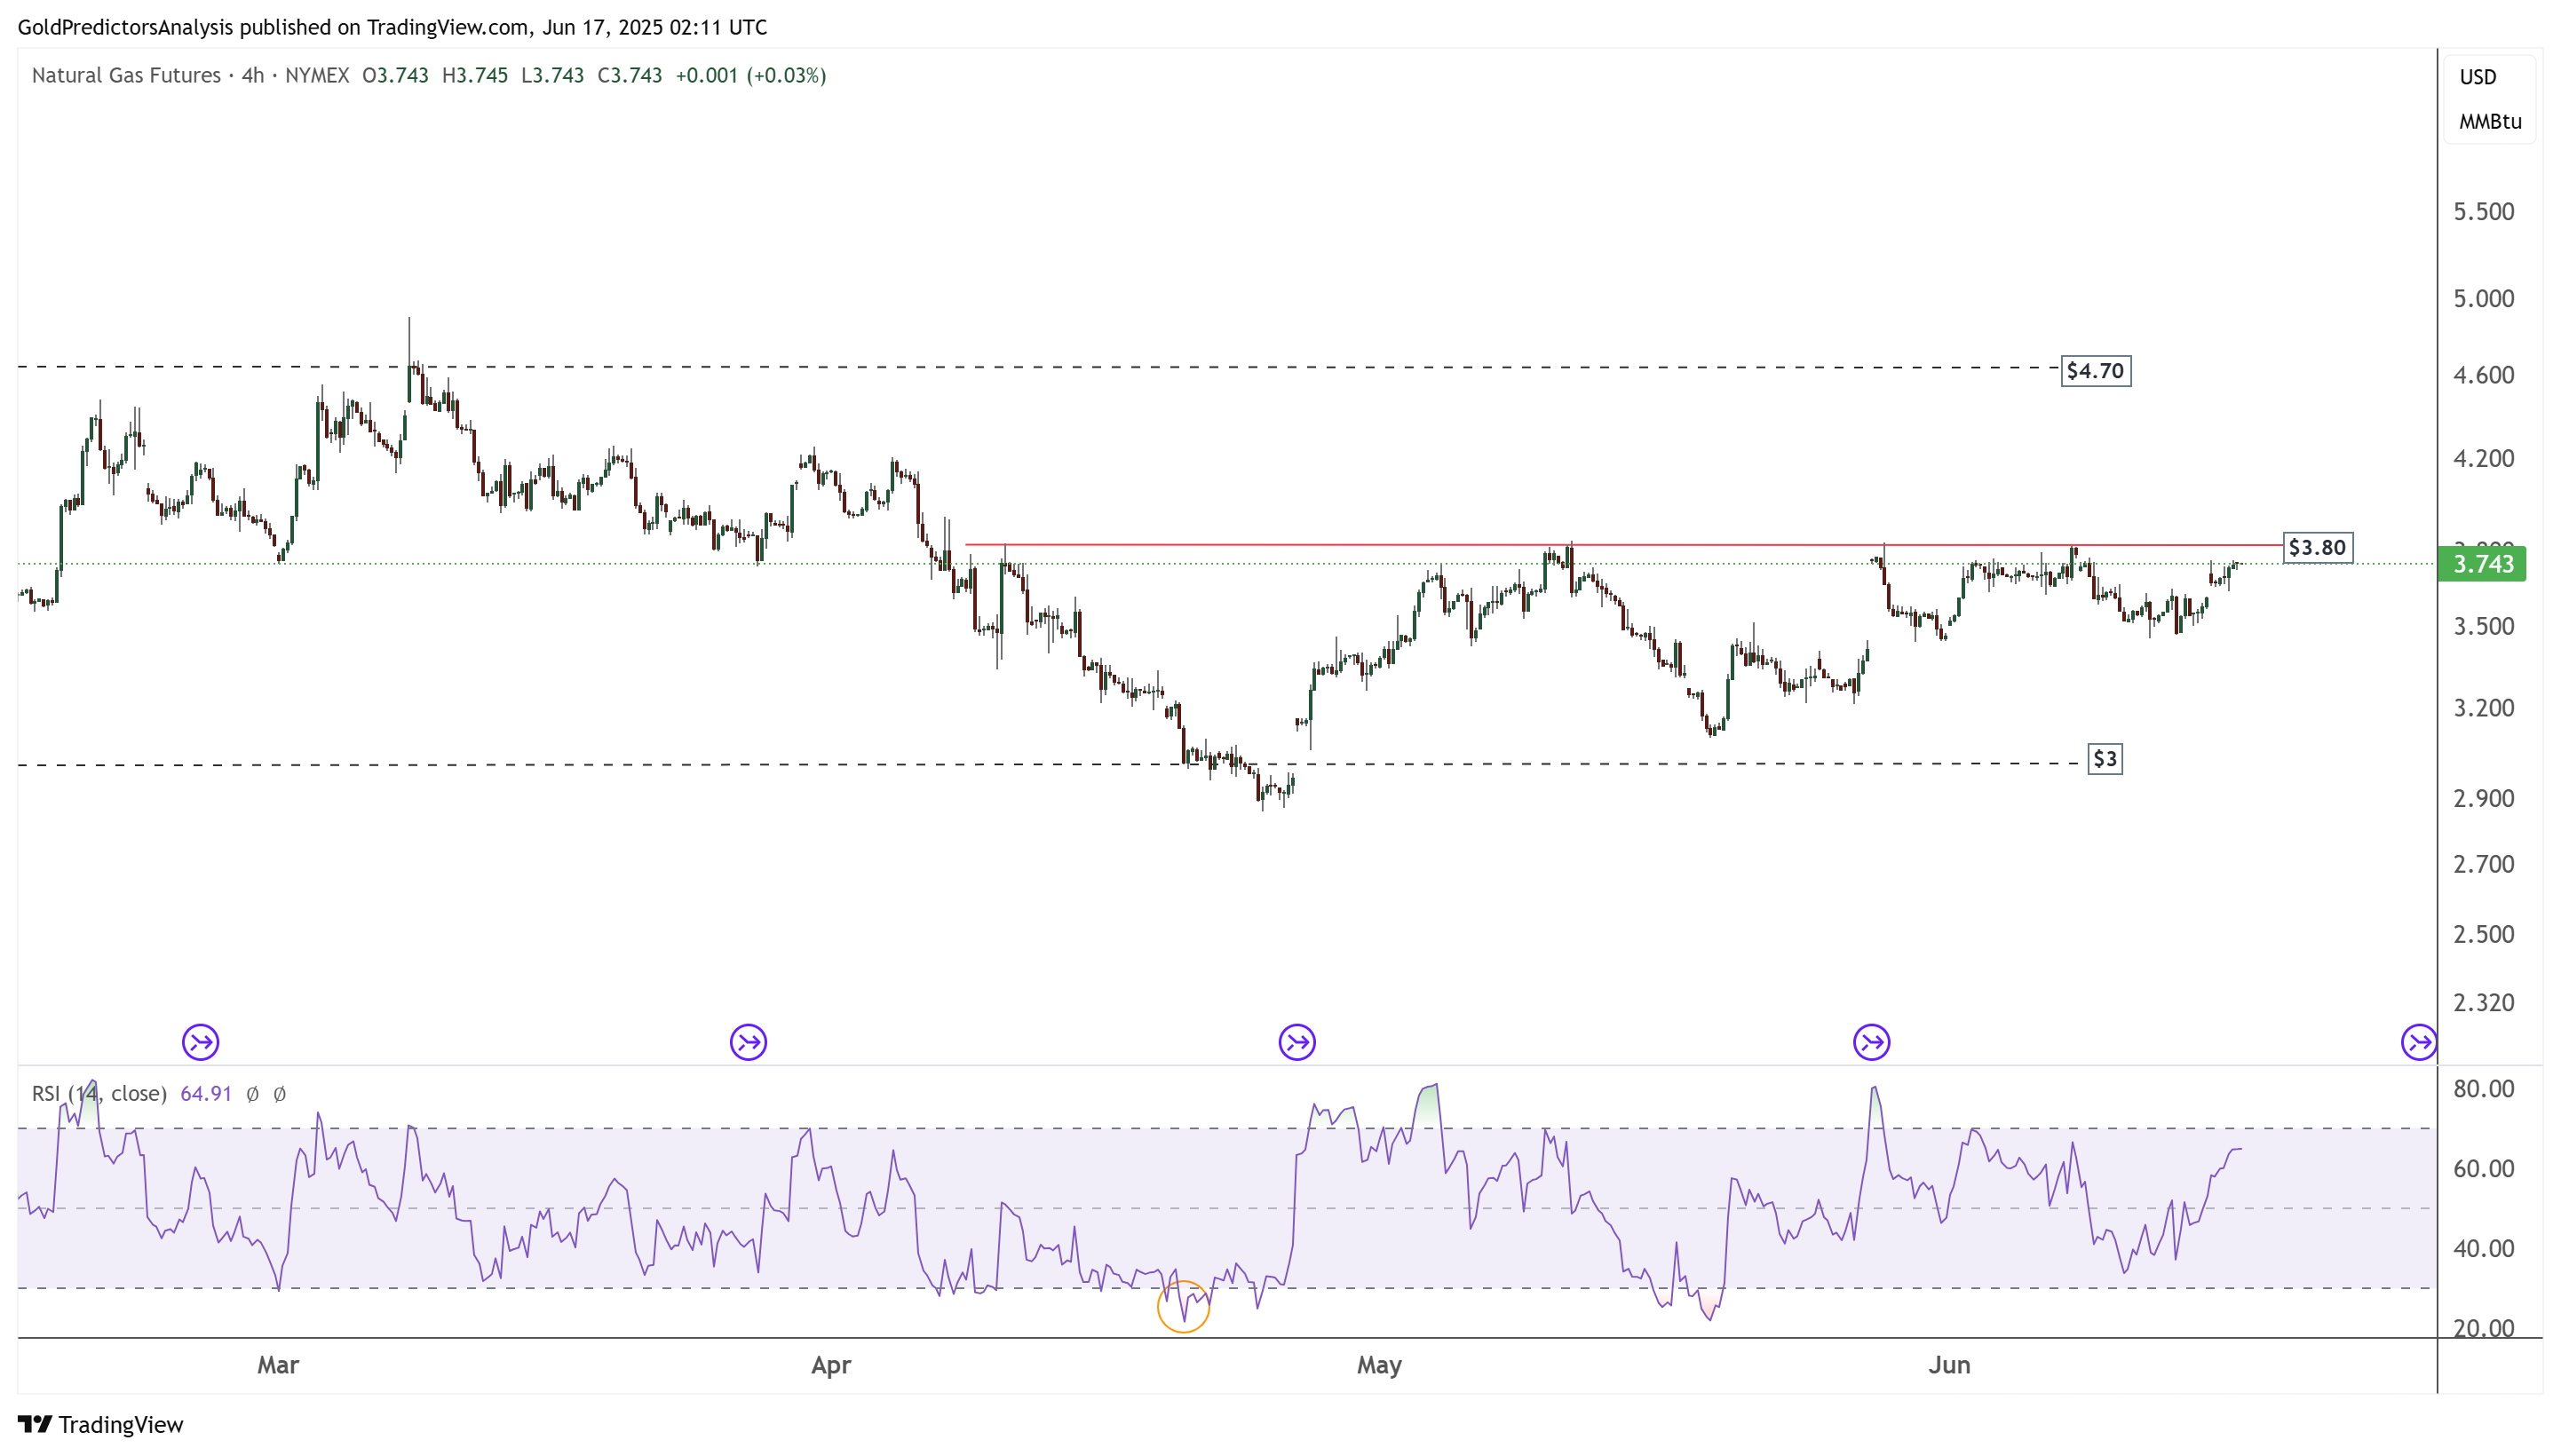
Natural Gas 4-Hour Chart – Consolidation
The 4-hour chart for natural gas shows that the price is forming a positive price structure above the $3.00 area. A break above $3.80 could trigger a move toward the $4.70 level. However, a break below $3.00 would likely initiate bearish momentum toward the $2.30 area.
US Dollar (DXY) Technical Analysis
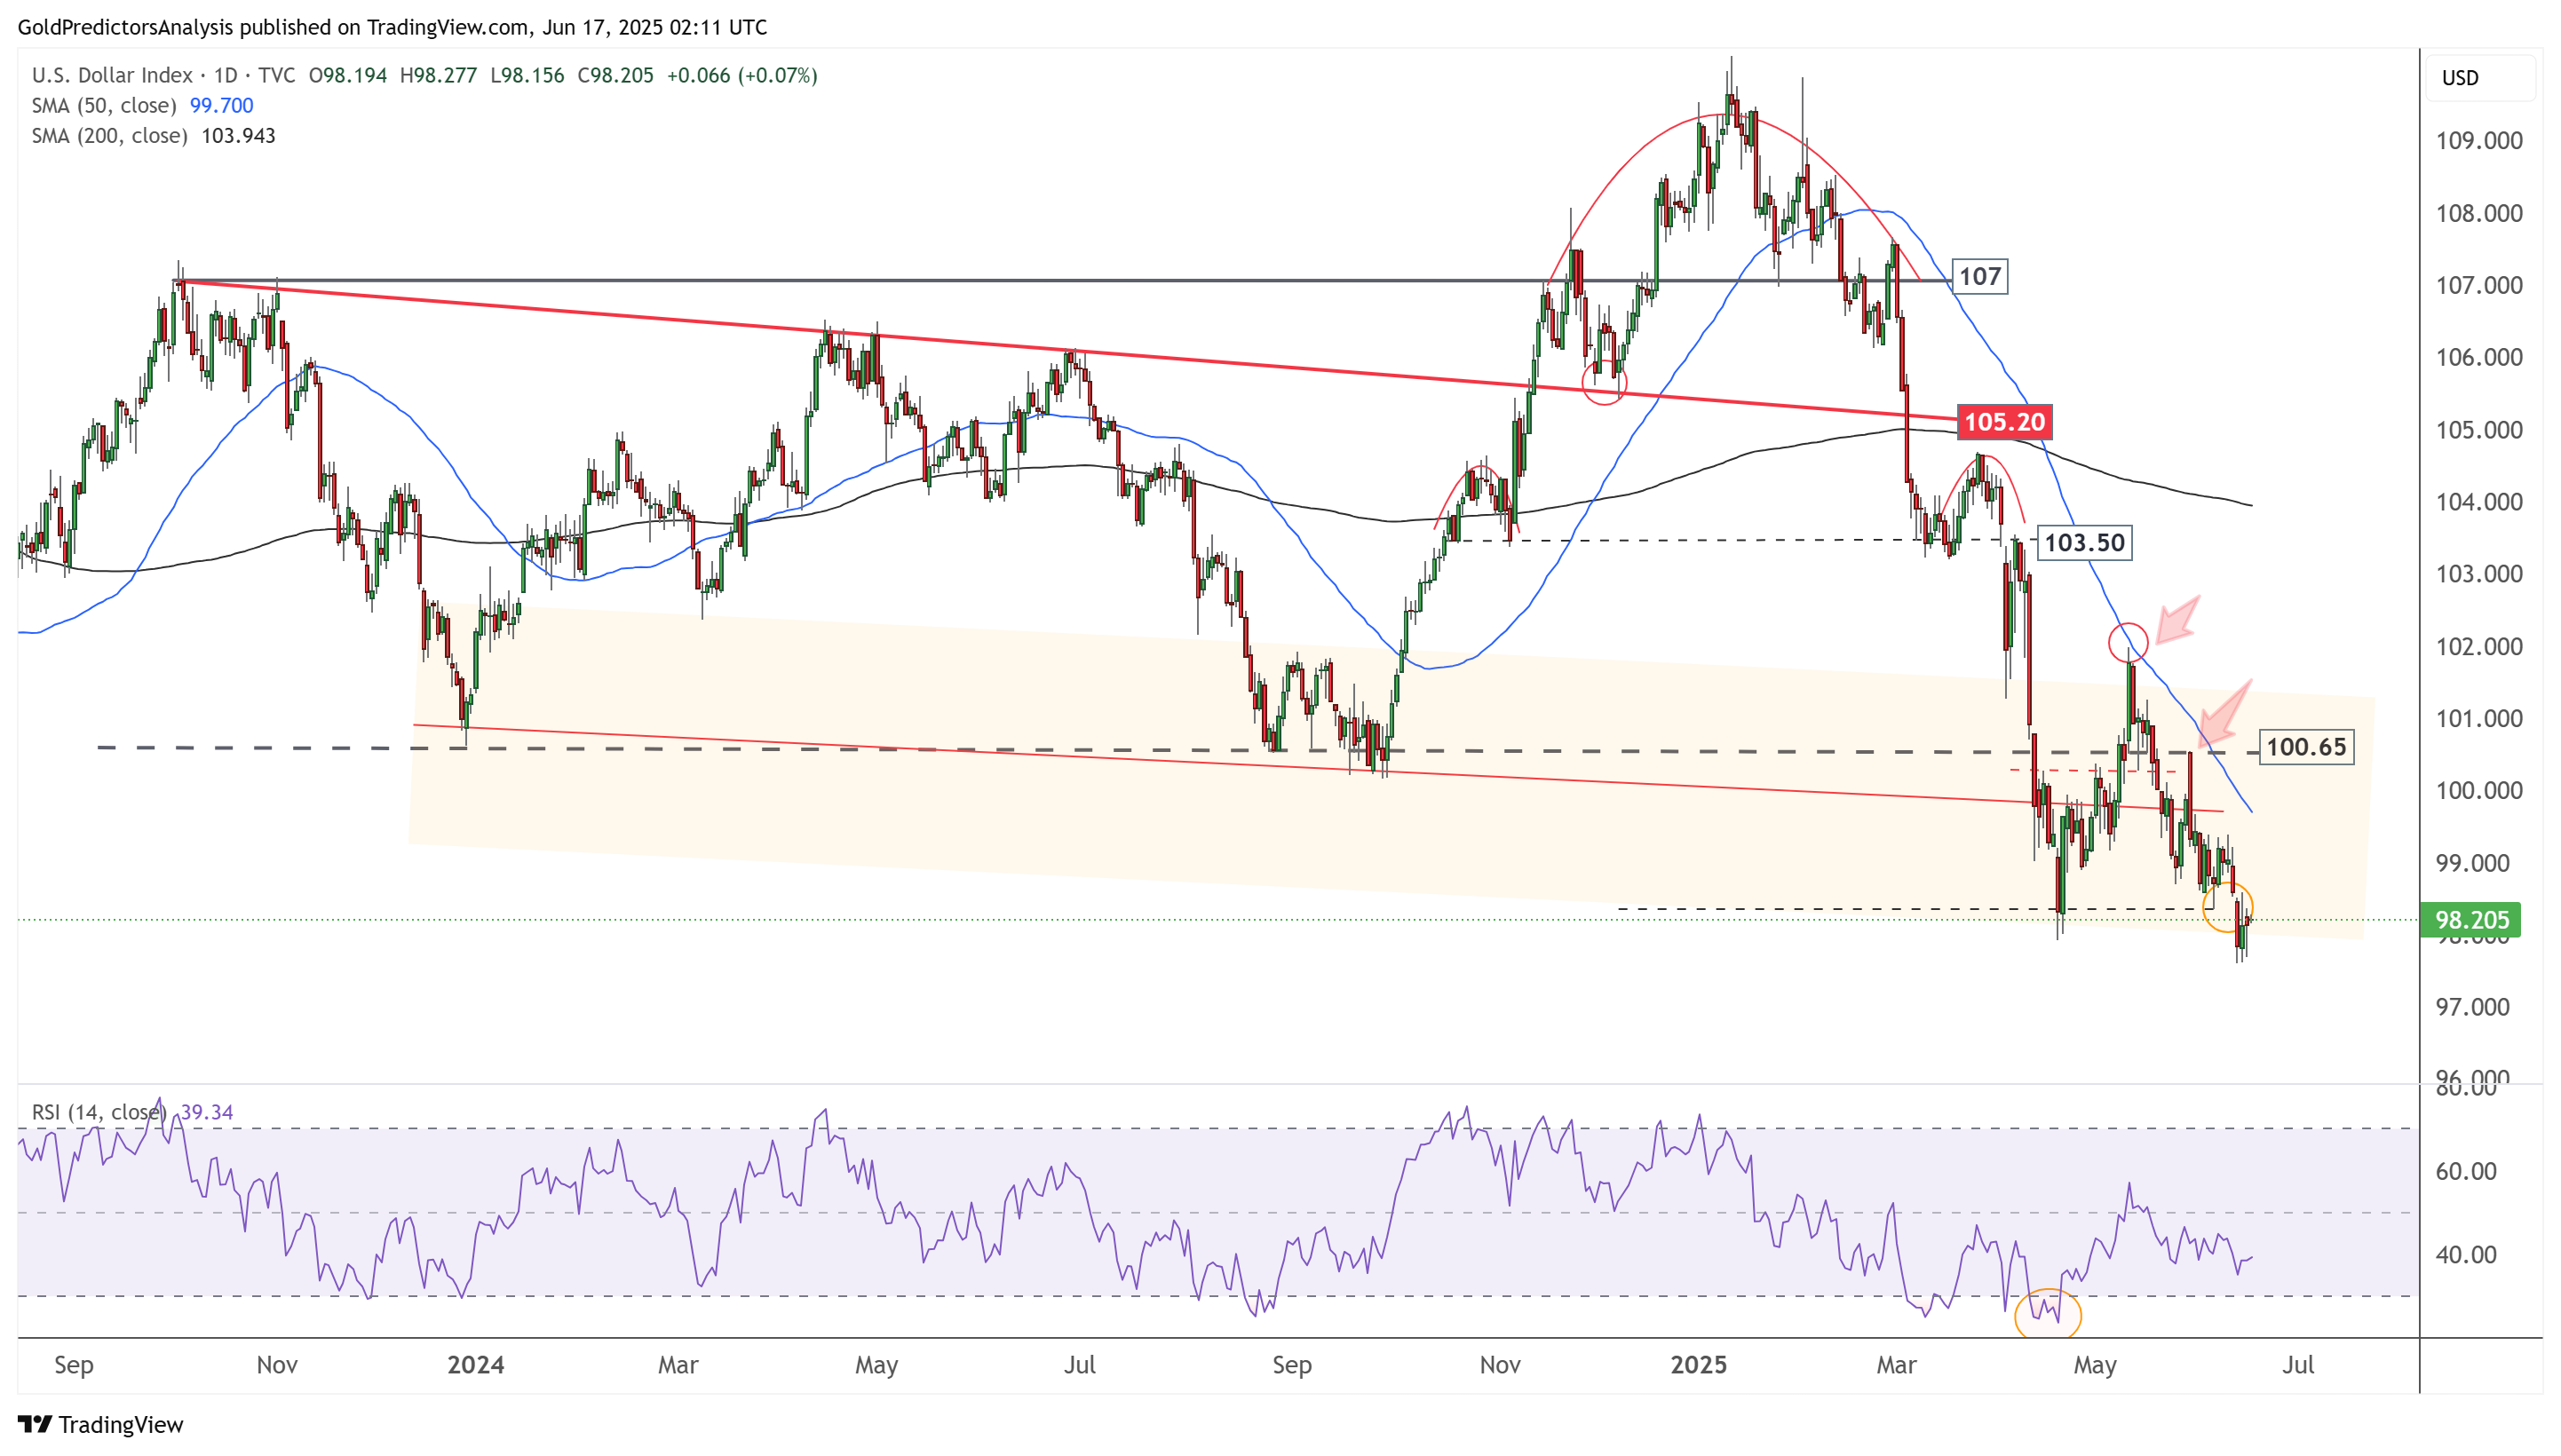
US Dollar Daily Chart – Bearish Pressure
The daily chart for the US Dollar Index indicates that it is trading under bearish pressure and forming a head-and-shoulders pattern. The index has broken below the 100.65 level and remains weak. As long as it stays below 100.65 and the 50-day SMA, further downside is likely.
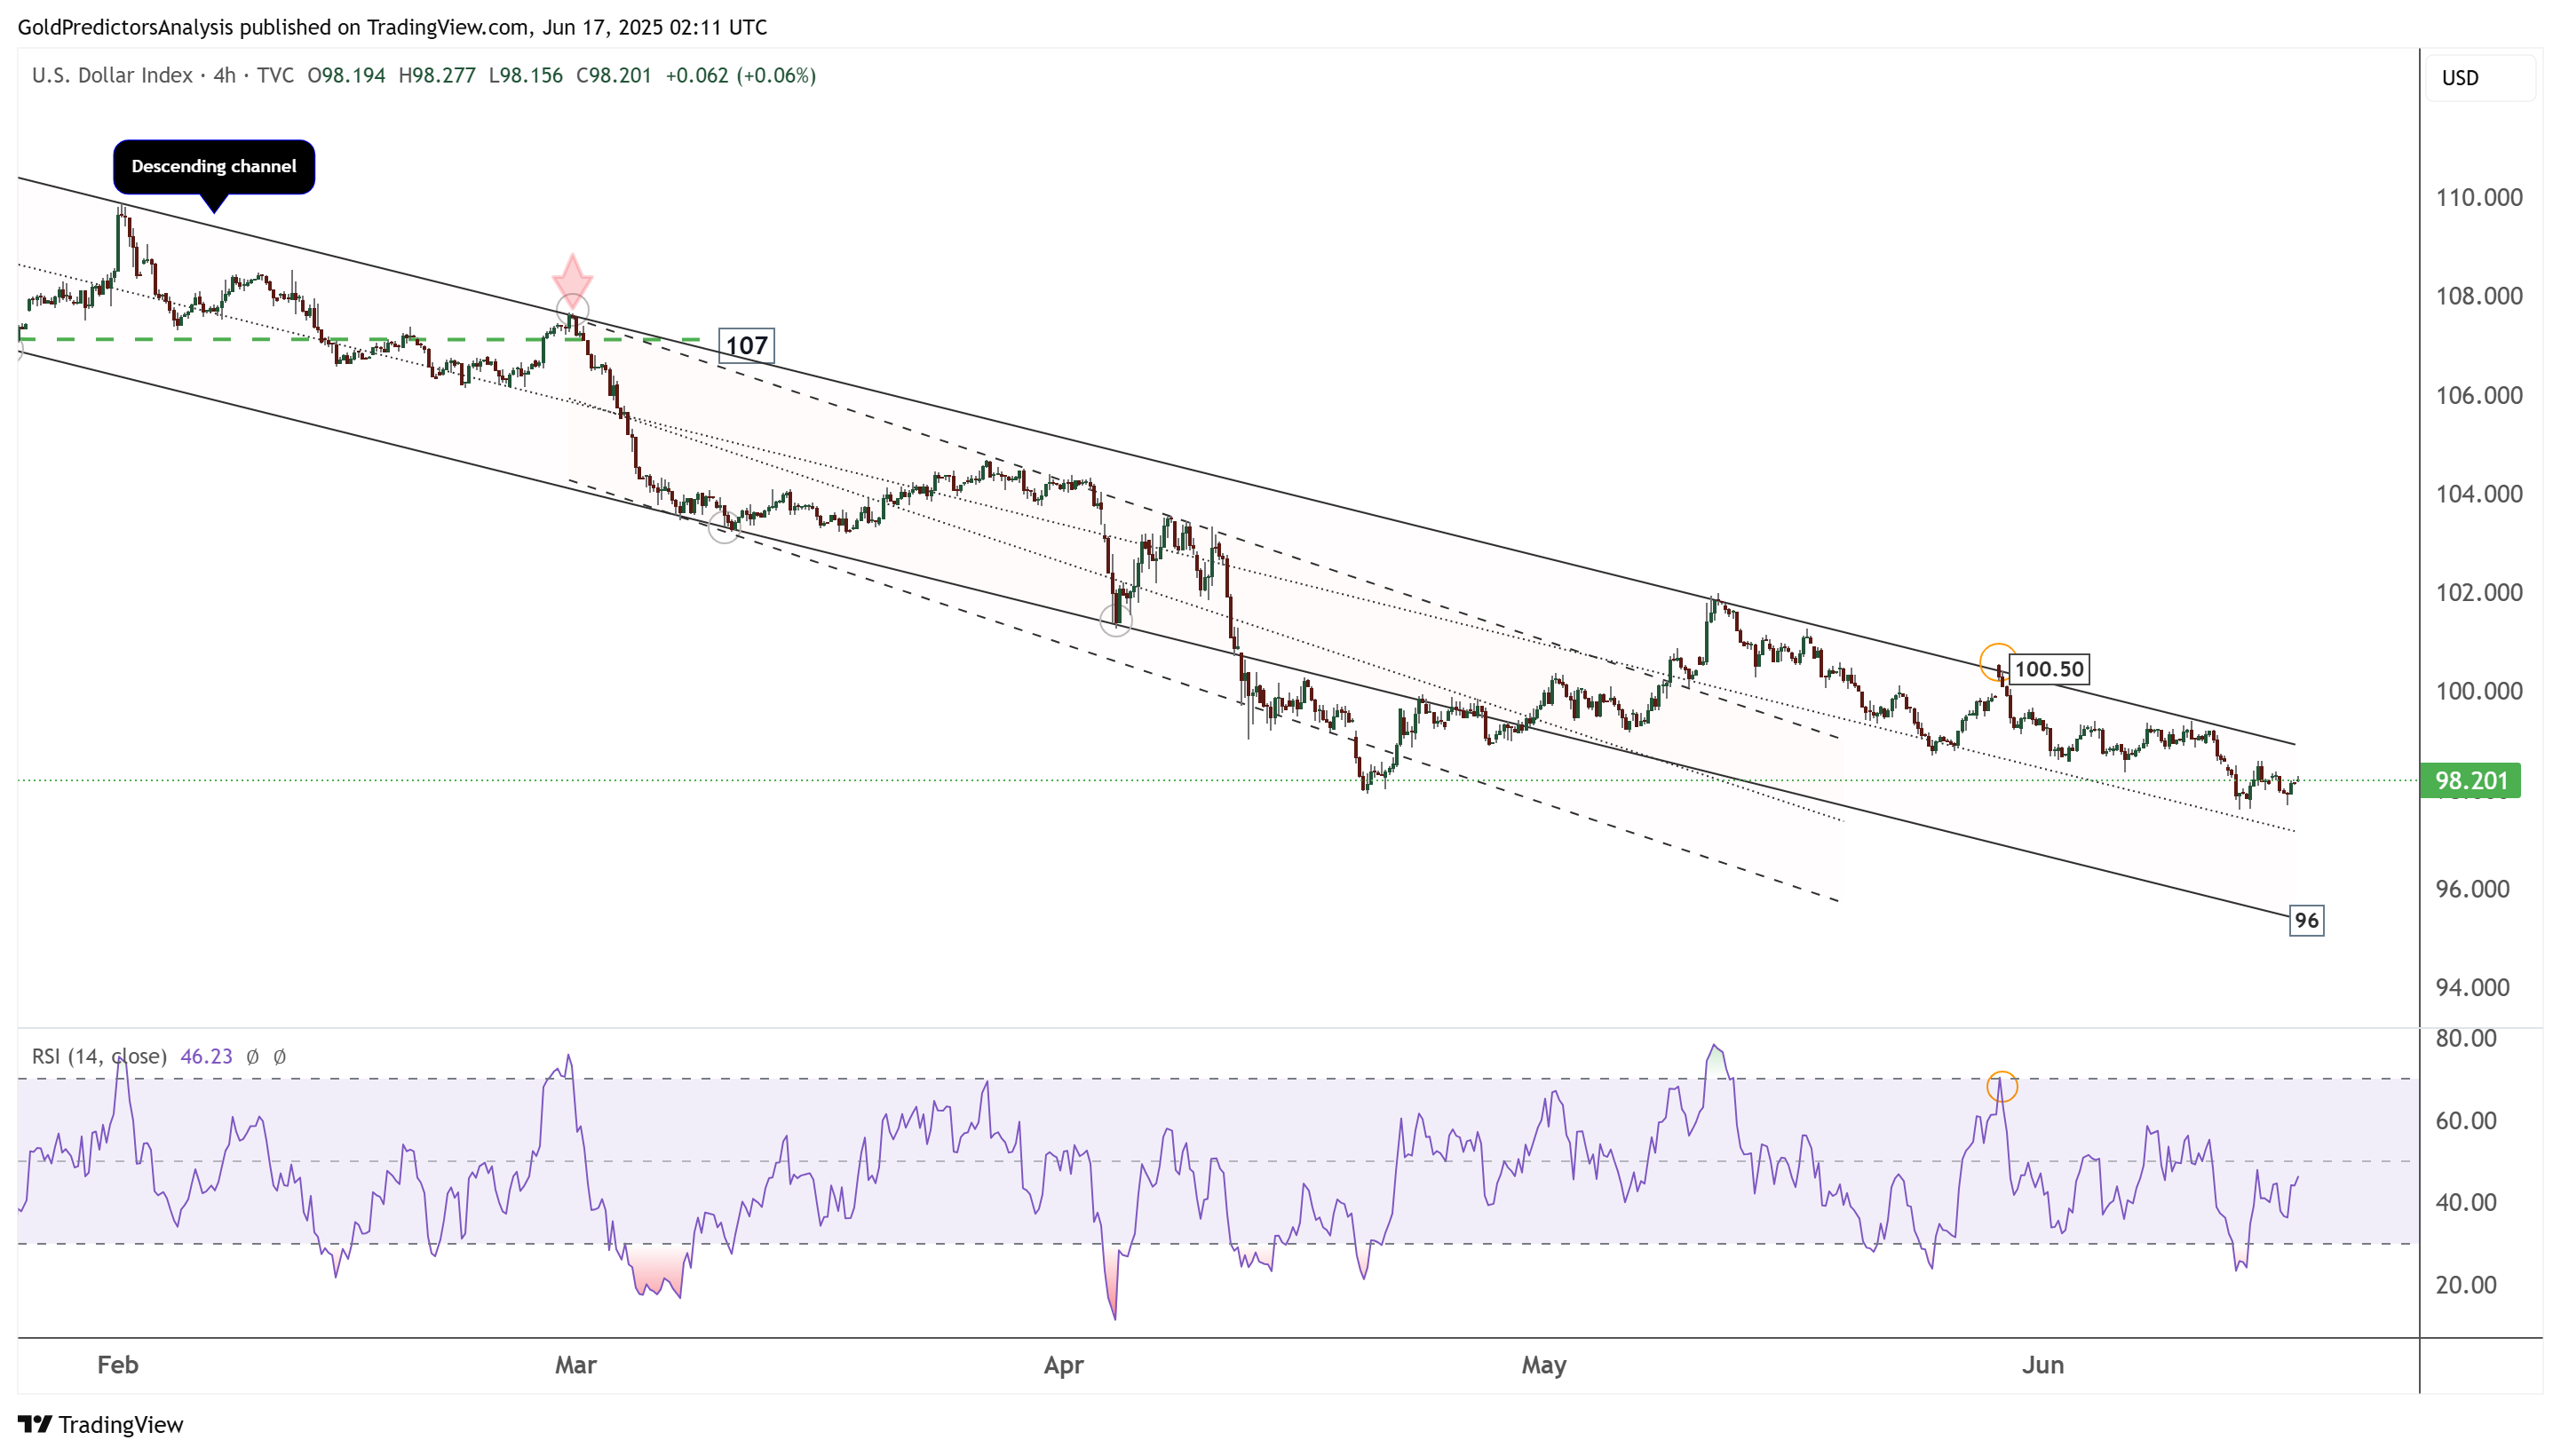
US Dollar 4-Hour Chart – Descending Channel
The 4-hour chart for the US Dollar Index shows that it is trading within a descending channel. The index is rebounding from the 98 level but remains under bearish pressure. As long as it remains below the pivotal 100.65 area, the downtrend is likely to continue toward the 95 level.
About the Author
Bob MasonChief Crypto Boss
123456789 30 He has written extensively for a broader audience and his current focus is on developments relating to the financial markets including, but not limited to currencies, commodities, alternative asset classes, and global equities.


Advertisement