
Advertisement
Advertisement
Memecoins Crash Amid Mounting Israel-Iran Conflict: Setups For PEPE, WIF, and SHIB
By:
Key Points:
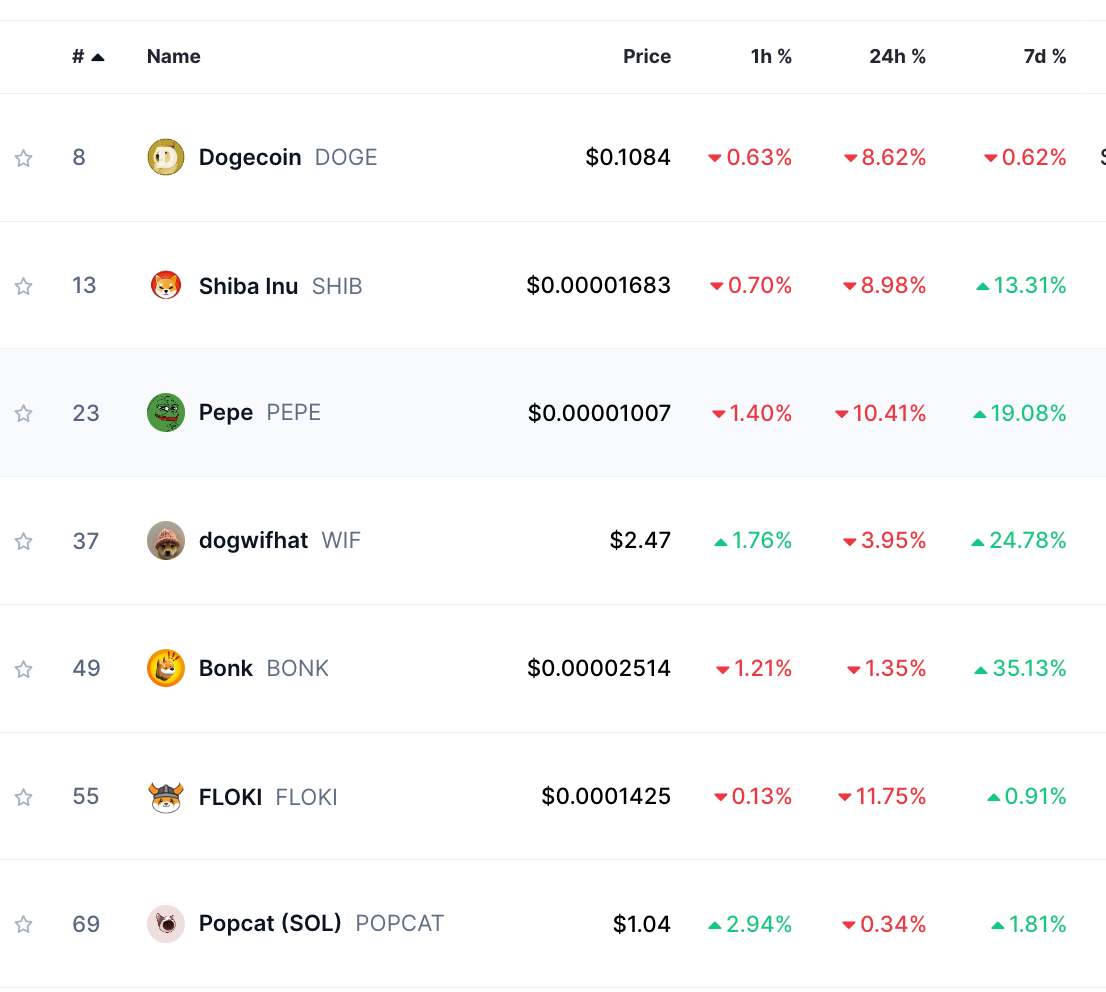
- PEPE eyes a potential breakout from a bull flag, targeting $0.00001366 if support holds.
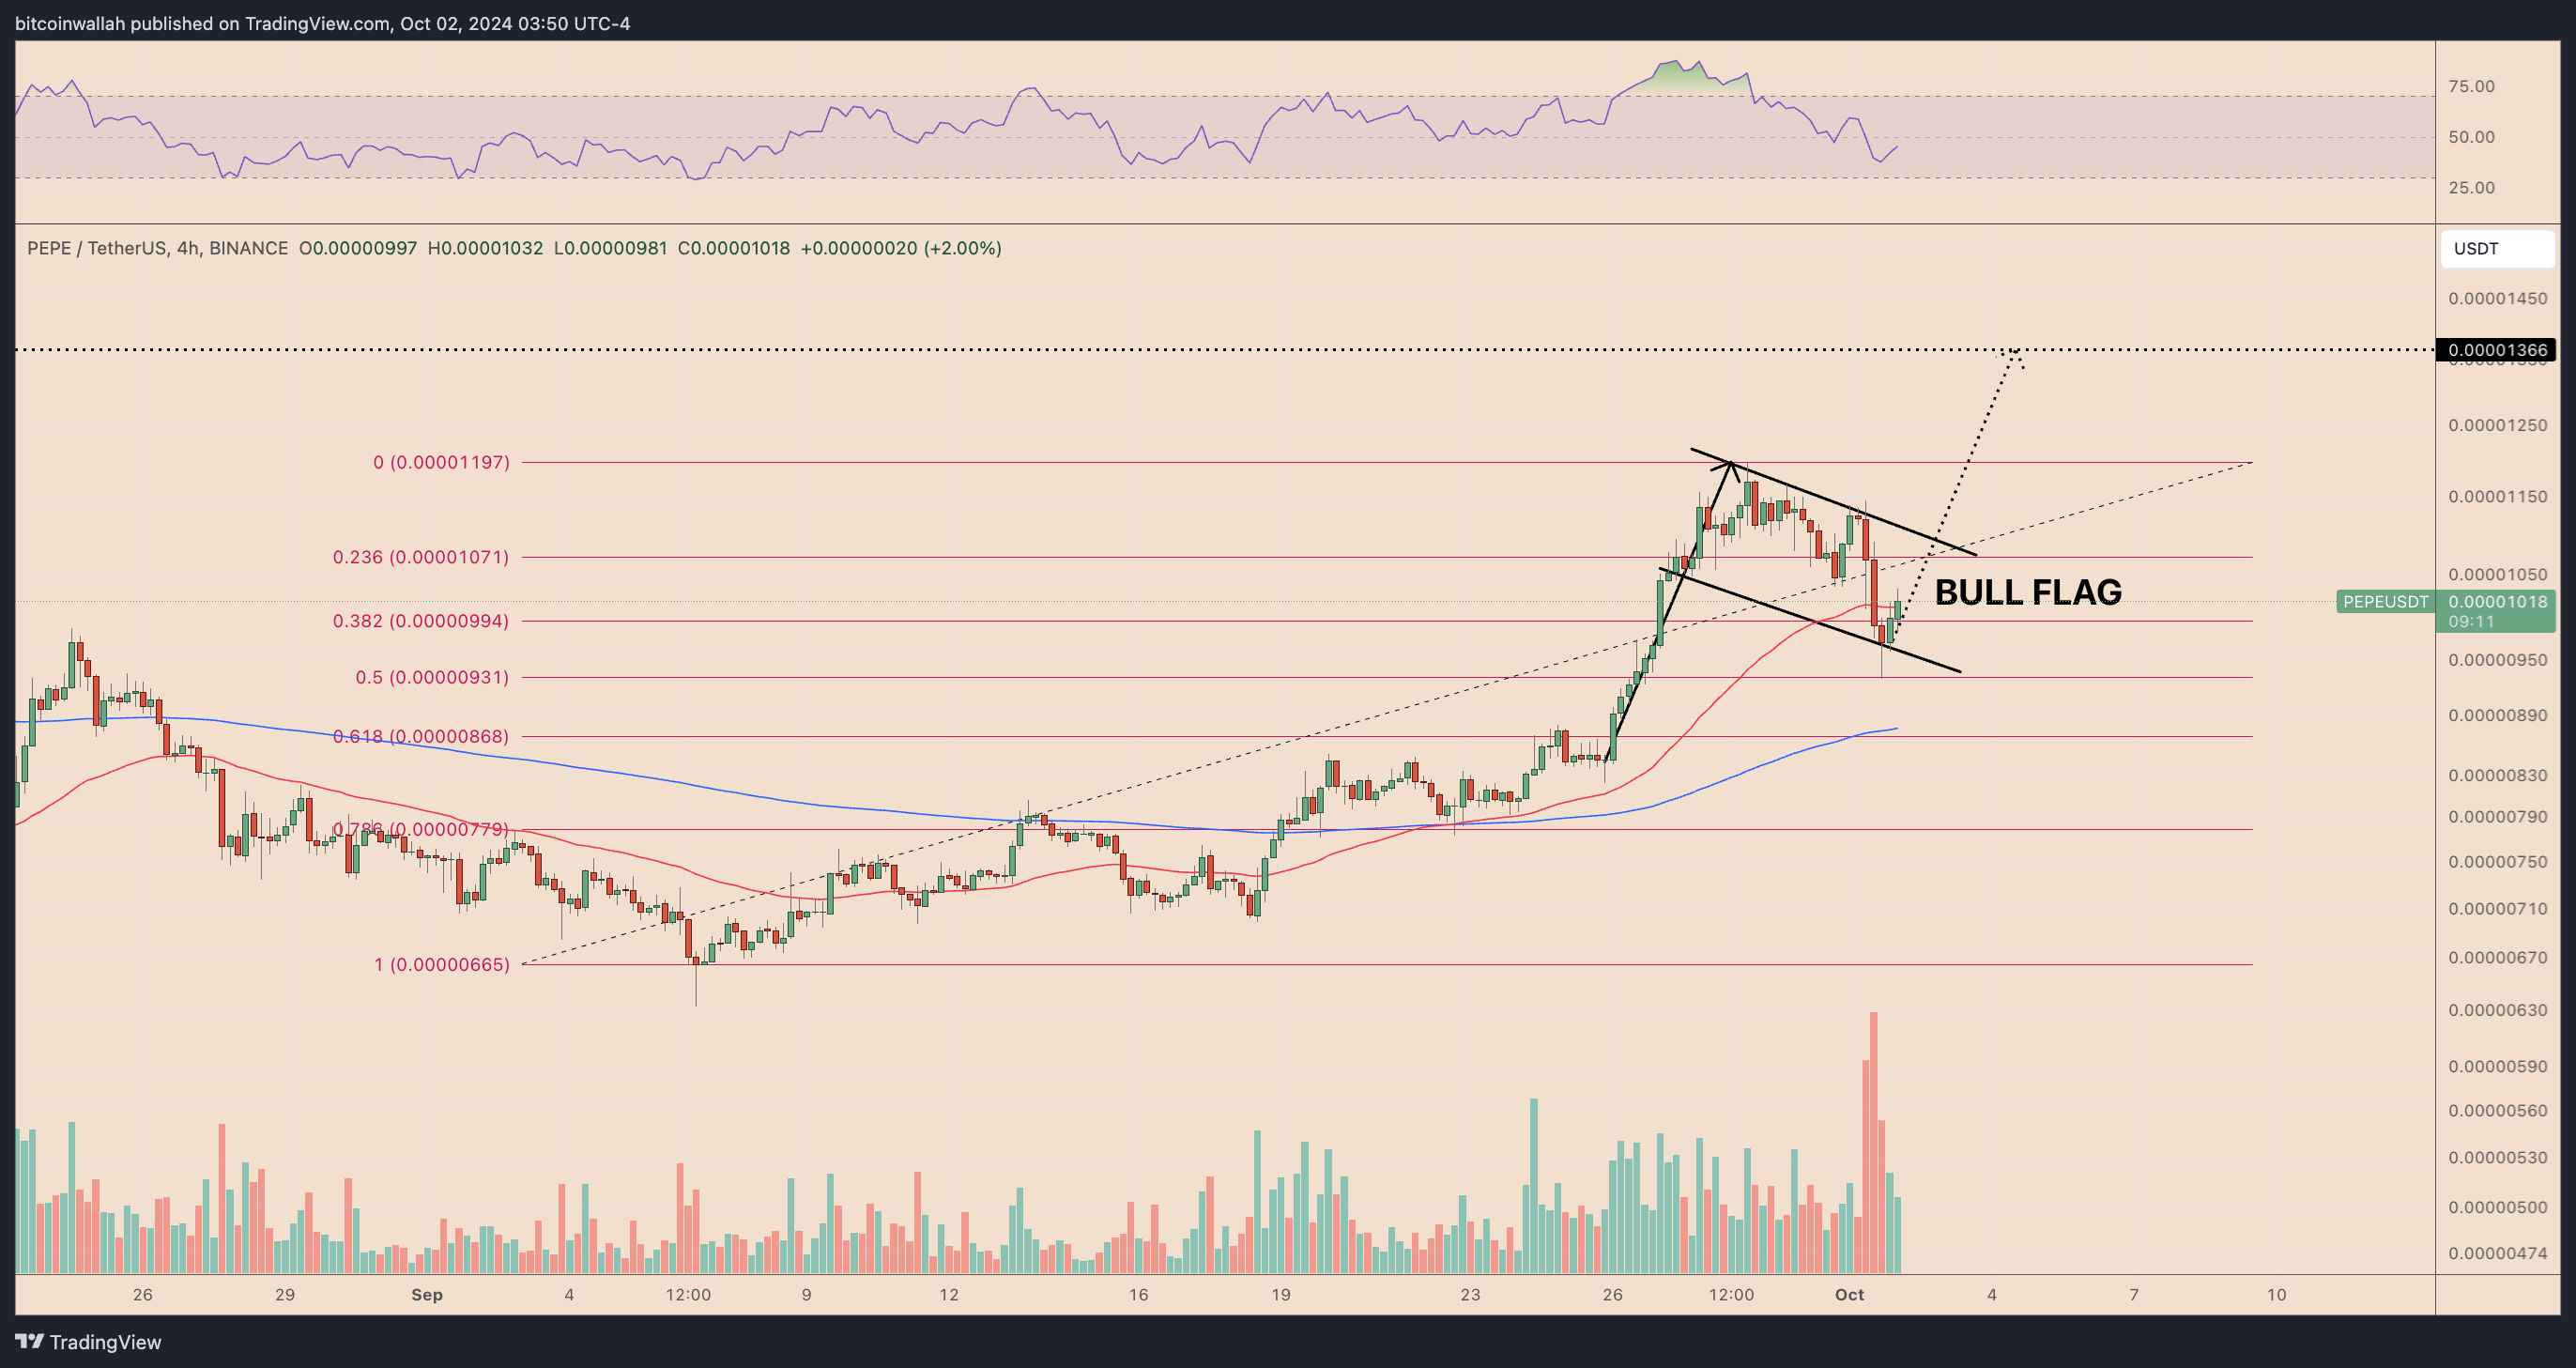
- WIF shows bearish divergence, signaling a possible decline toward $1.89.
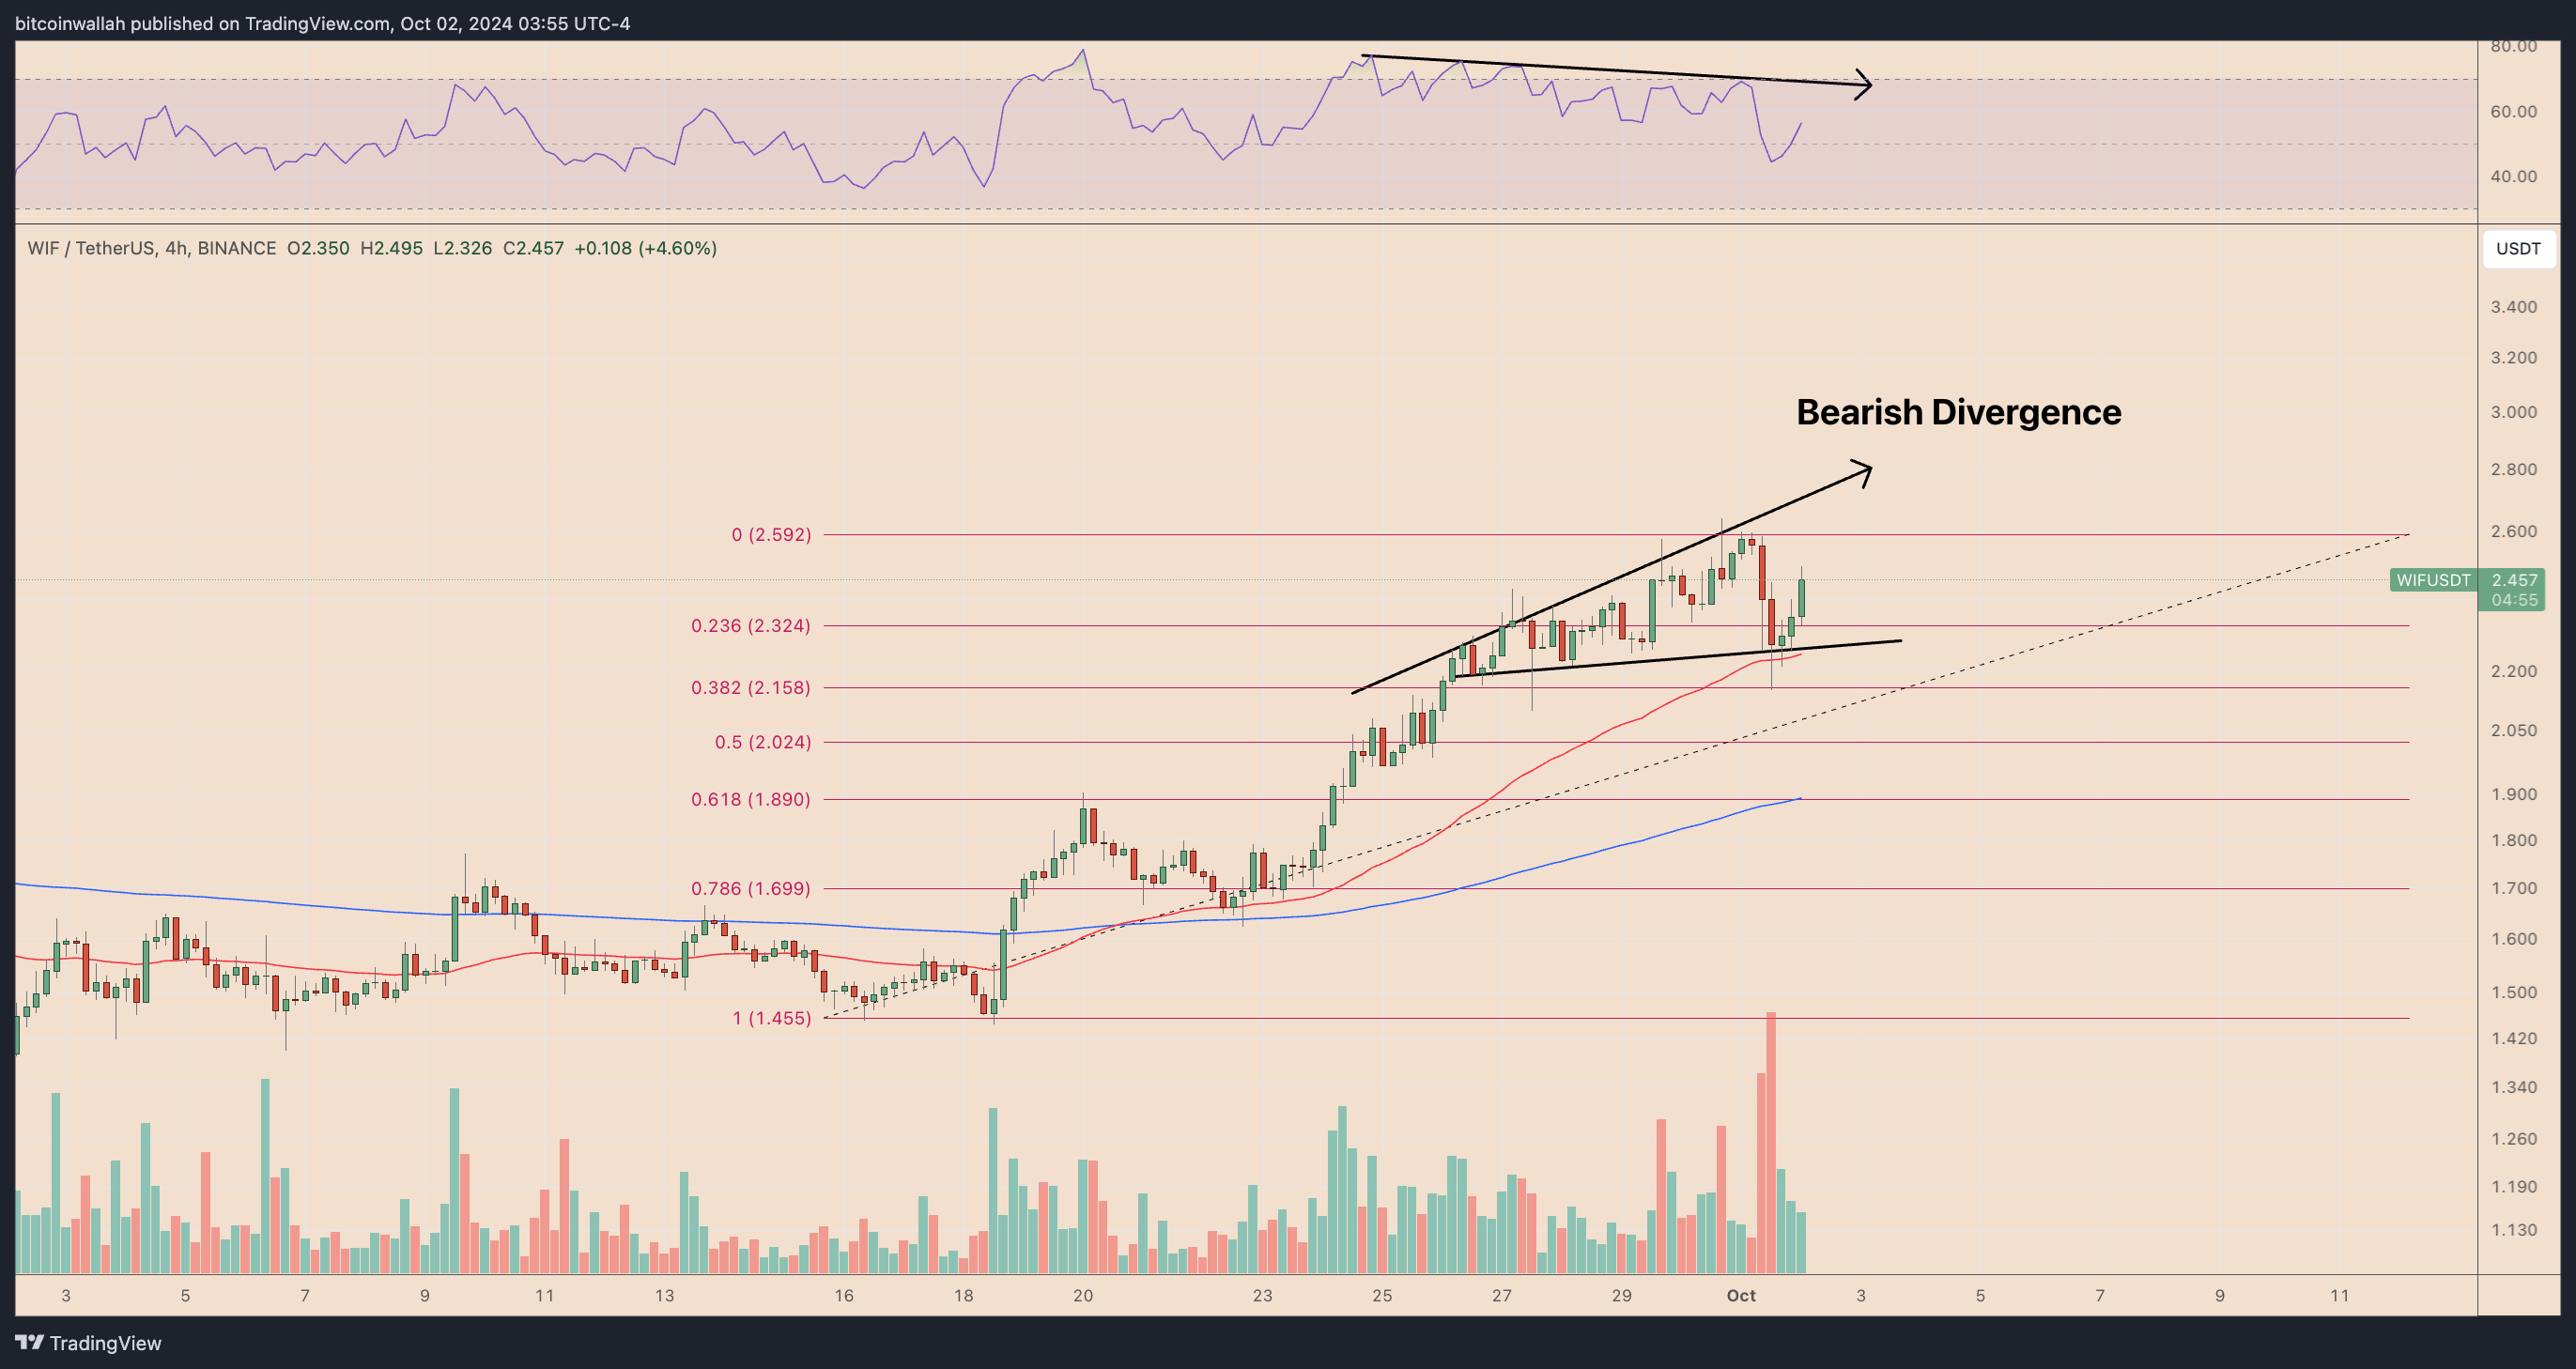
- SHIB faces strong resistance, with potential consolidation around $0.00001596 before another upward move.

In this article:
The escalating conflict between Israel and Lebanon, which now involves tensions with Iran, has created uncertainty in global markets. Geopolitical tensions typically lead to a flight to safety, where investors reduce exposure to high-risk assets like cryptocurrencies and pivot to safer investments such as government bonds, gold, or the US dollar.
On Oct. 1, data from the US Labor Department showed that job openings in August unexpectedly rose after two consecutive months of declines. This uptick hints that the labor market may still have strength, potentially reducing the immediate need for the Federal Reserve to pivot toward a more dovish monetary policy stance.
PEPE Technical Analysis: Will The Memecoin Rise in October 2024?
PEPE/USDT is currently in a bull flag formation, confirmed by the price consolidating inside a downward-sloped parallel channel following a major price rally. Bull flags typically resolve when the price breaks above the upper trendline and rises as much as the previous uptrend’s height.
The price is testing the 0.5 Fibonacci retracement level near $0.00000931 as support. If this level holds, PEPE may break out of the flag toward the next resistance at $0.00001366 (the flag’s height projection) in October.
However, a breakdown below the flag’s lower trendline could invalidate the bullish setup, possibly leading to a deeper correction towards $0.00000868 (the 0.618 Fib level).
Dogwifhat (WIF) Technical Analysis: WIF Eyes Major Decline?
WIF/USDT shows signs of bearish divergence between the price and the Relative Strength Index (RSI) on the 4-hour chart. While WIF has maintained higher highs, the RSI has formed lower highs, signaling potential weakening momentum.
A breakdown below the current ascending wedge could push WIF towards its 0.5 Fibonacci level near $2.02. However, if the divergence continues with increased selling pressure, WIF could decline toward the 0.618 Fib at $1.89.
A breakdown below this level could show that SHIB retested the 0.786 Fib level at $0.00002037. If the support holds, SHIB may consolidate before attempting another upward breakout toward $0.00001789.
About the Author
Bob MasonChief Crypto Boss
TEST 30 He has written extensively for a broader audience and his current focus is on developments relating to the financial markets including, but not limited to currencies, commodities, alternative asset classes, and global equities.
Latest news and analysis


Advertisement