
Advertisement
Advertisement
Gold (XAUUSD) Coils Near Breakout as US-Iran Tensions Fuel Safe-Haven Demand
By:
Key Points:
- Gold (XAUUSD) is coiling within the ascending triangle and preparing for the next move.
- Silver (XAGUSD) is pulling back from overbought levels and appears to be finding support between $35.50 and $35.
- The US Dollar Index (DXY) is rebounding from 98.00 and is likely to face resistance around the 100.50 zone.

The US launched bunker-buster airstrikes on Iran’s nuclear site on Sunday, escalating its involvement in the Israel-Iran conflict. President Trump declared the attack a military success and hinted at regime change, while Iran vowed retaliation. Missile exchanges between Iran and Israel continued, and Iran’s parliament approved a plan to close the Strait of Hormuz—a critical route for global oil shipments. The US also issued a global security alert, warning Americans of protests and potential threats abroad.
These developments sparked immediate investor concern and increased global risk aversion. Gold (XAUUSD) opened with an upside gap and climbed near $3,400 in early Asian trading on Monday. However, amid rising market uncertainty, the price dropped to $3,350. The threat of regional war, combined with US participation and Iran’s vow to retaliate, intensified safe-haven demand. Gold benefits from geopolitical crises, and the current situation presents a clear risk to global stability and energy markets, reinforcing its role as a hedge.
The possibility of Iran closing the Strait of Hormuz could trigger oil supply shocks and fuel inflation. WTI crude oil (CL) hit $77, while Brent crude oil (BCO) rose above $80 on Monday. These spikes in oil prices may weaken confidence in fiat currencies and strengthen gold’s appeal as a store of value. Moreover, any cyberattacks or retaliatory strikes against US targets could prolong market uncertainty and further boost demand for gold.
On the other hand, Federal Reserve Governor Christopher Waller signaled that rate cuts may begin as early as July. This has created additional uncertainty around the US dollar, which strengthens the outlook for gold.
Gold Technical Analysis
XAUUSD Daily Chart – Coiling
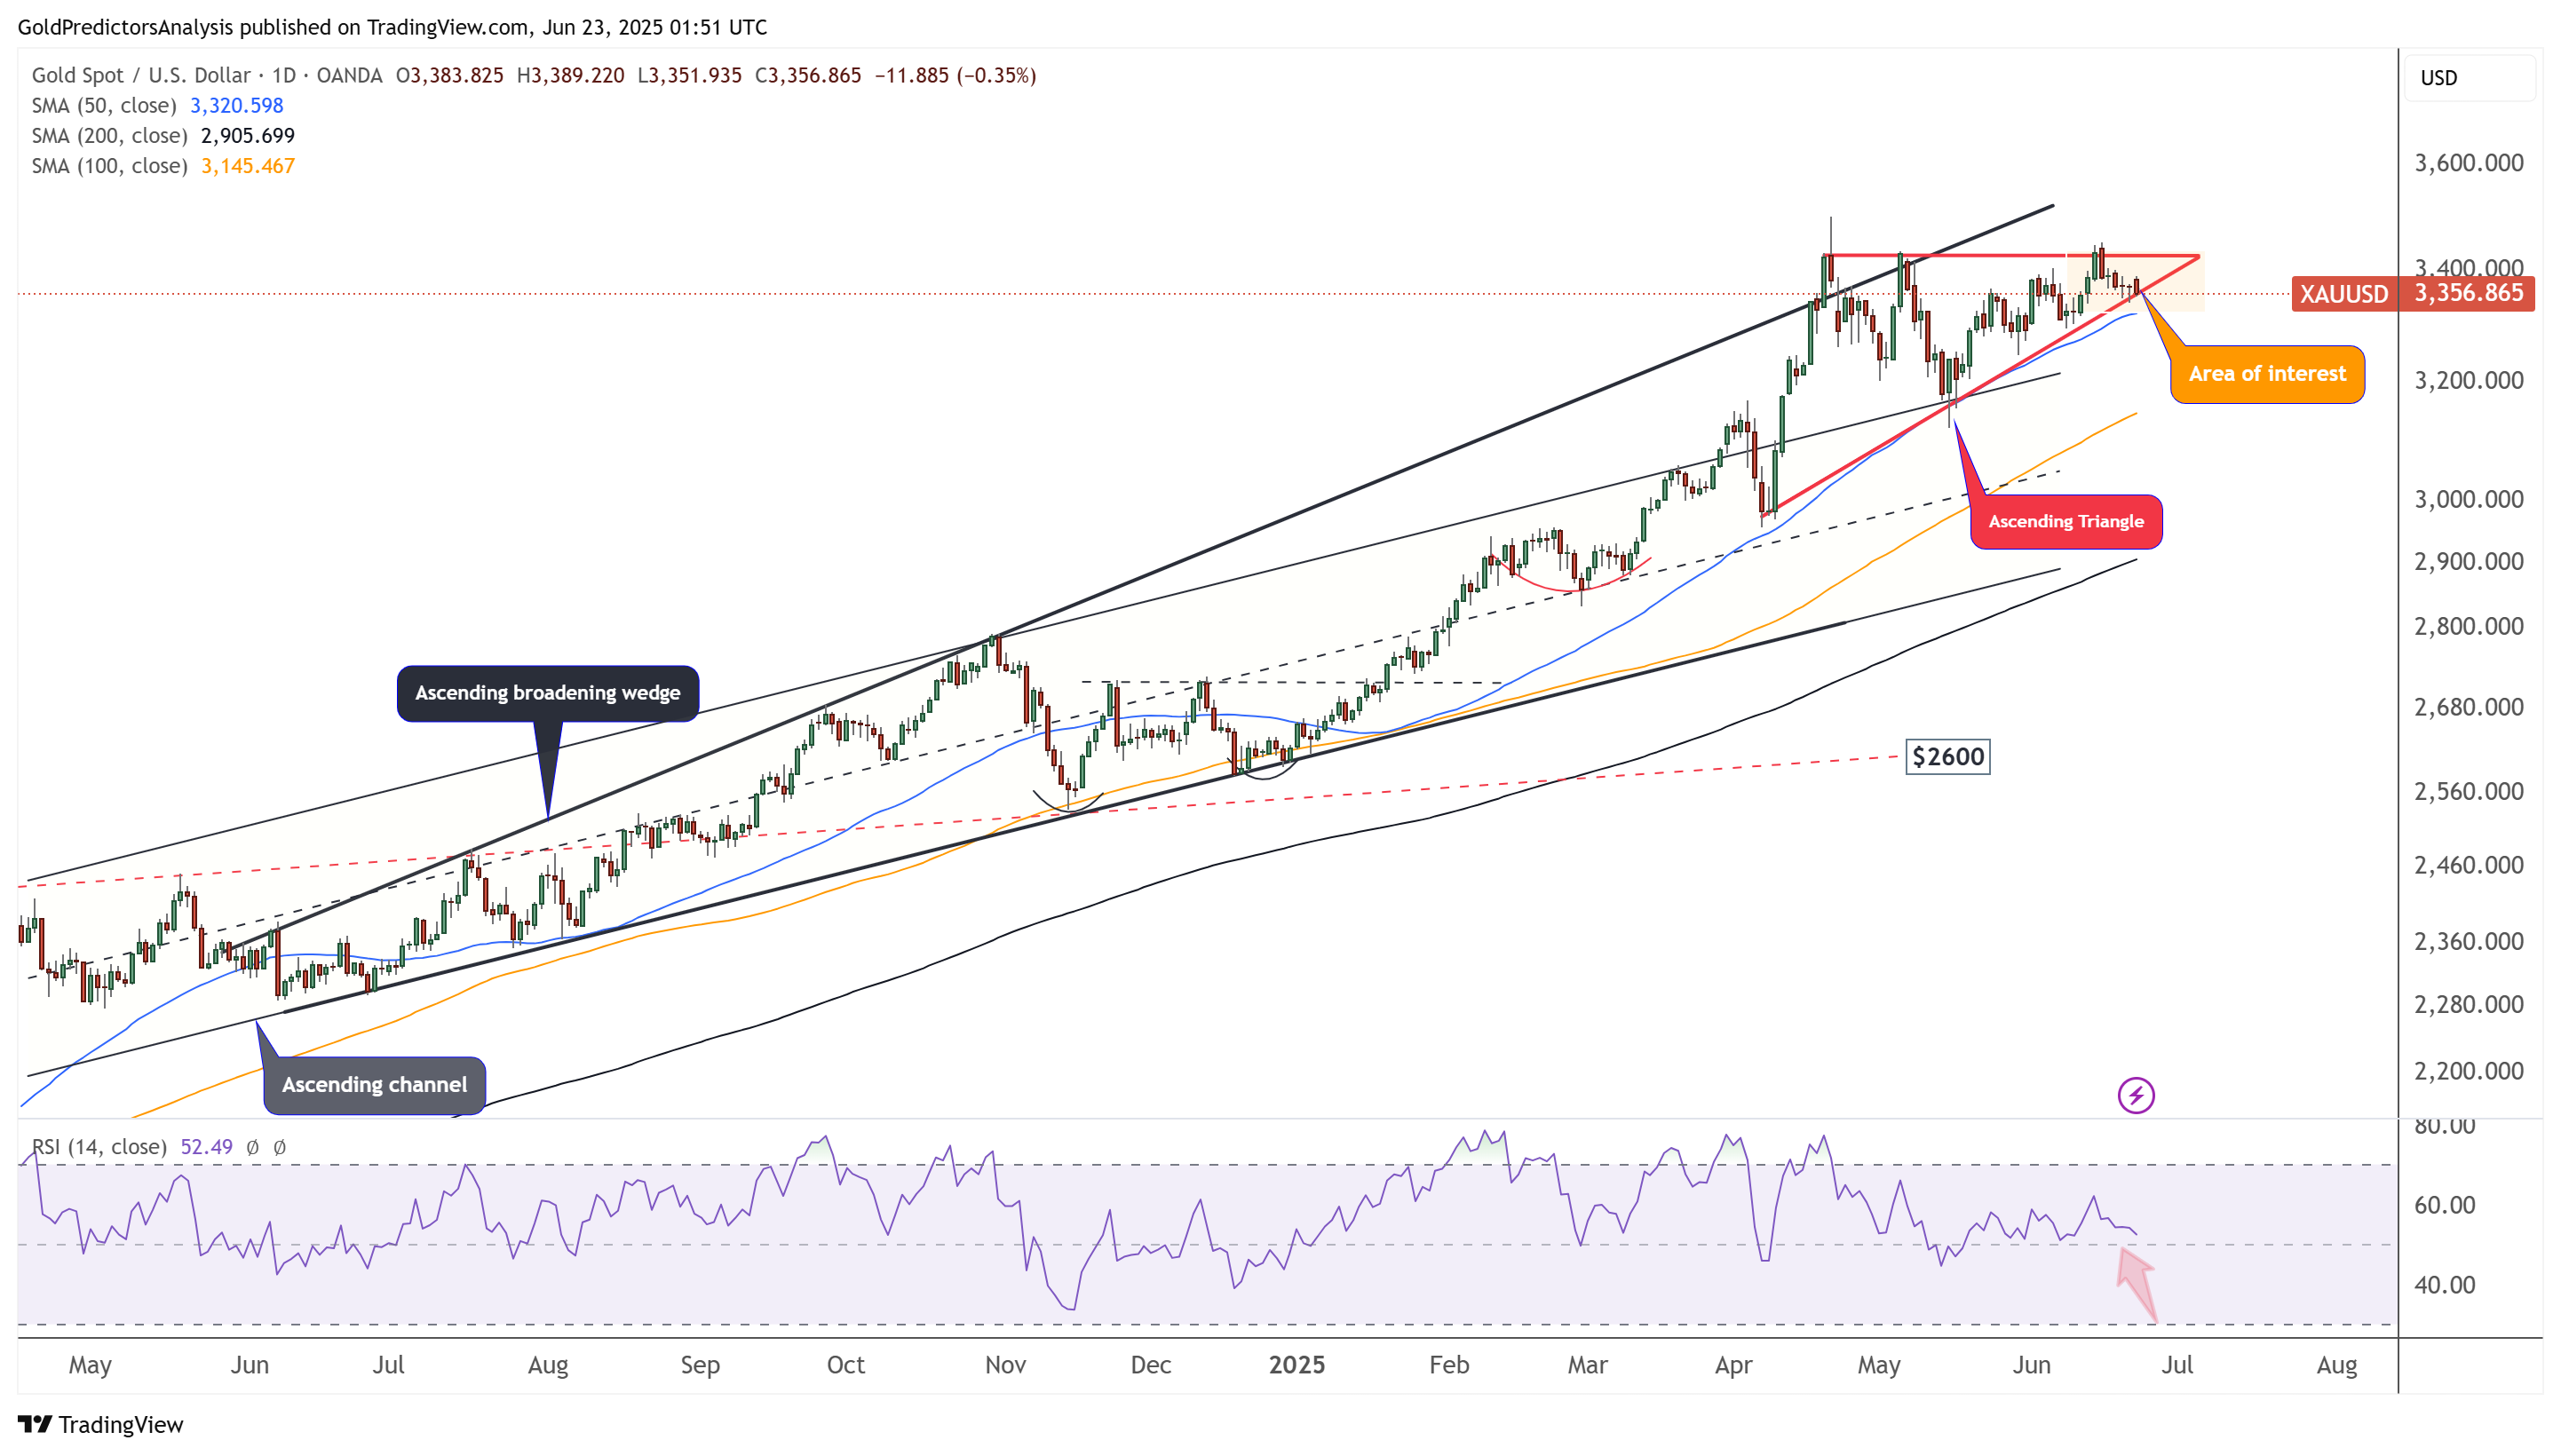
The daily chart for spot gold indicates that the price is consolidating within an ascending triangle, signalling a potential next move. The consolidation near the edge of this triangle indicates a coiling pattern and a break above $3,450 could trigger a strong surge in gold prices.
Additionally, the price is holding above the 50-day and 200-day SMA, signaling the building of positive momentum. Moreover, the RSI remains above the 50 level, further indicating a bullish trend.
XAUUSD 4-Hour Chart – Positive Price Development
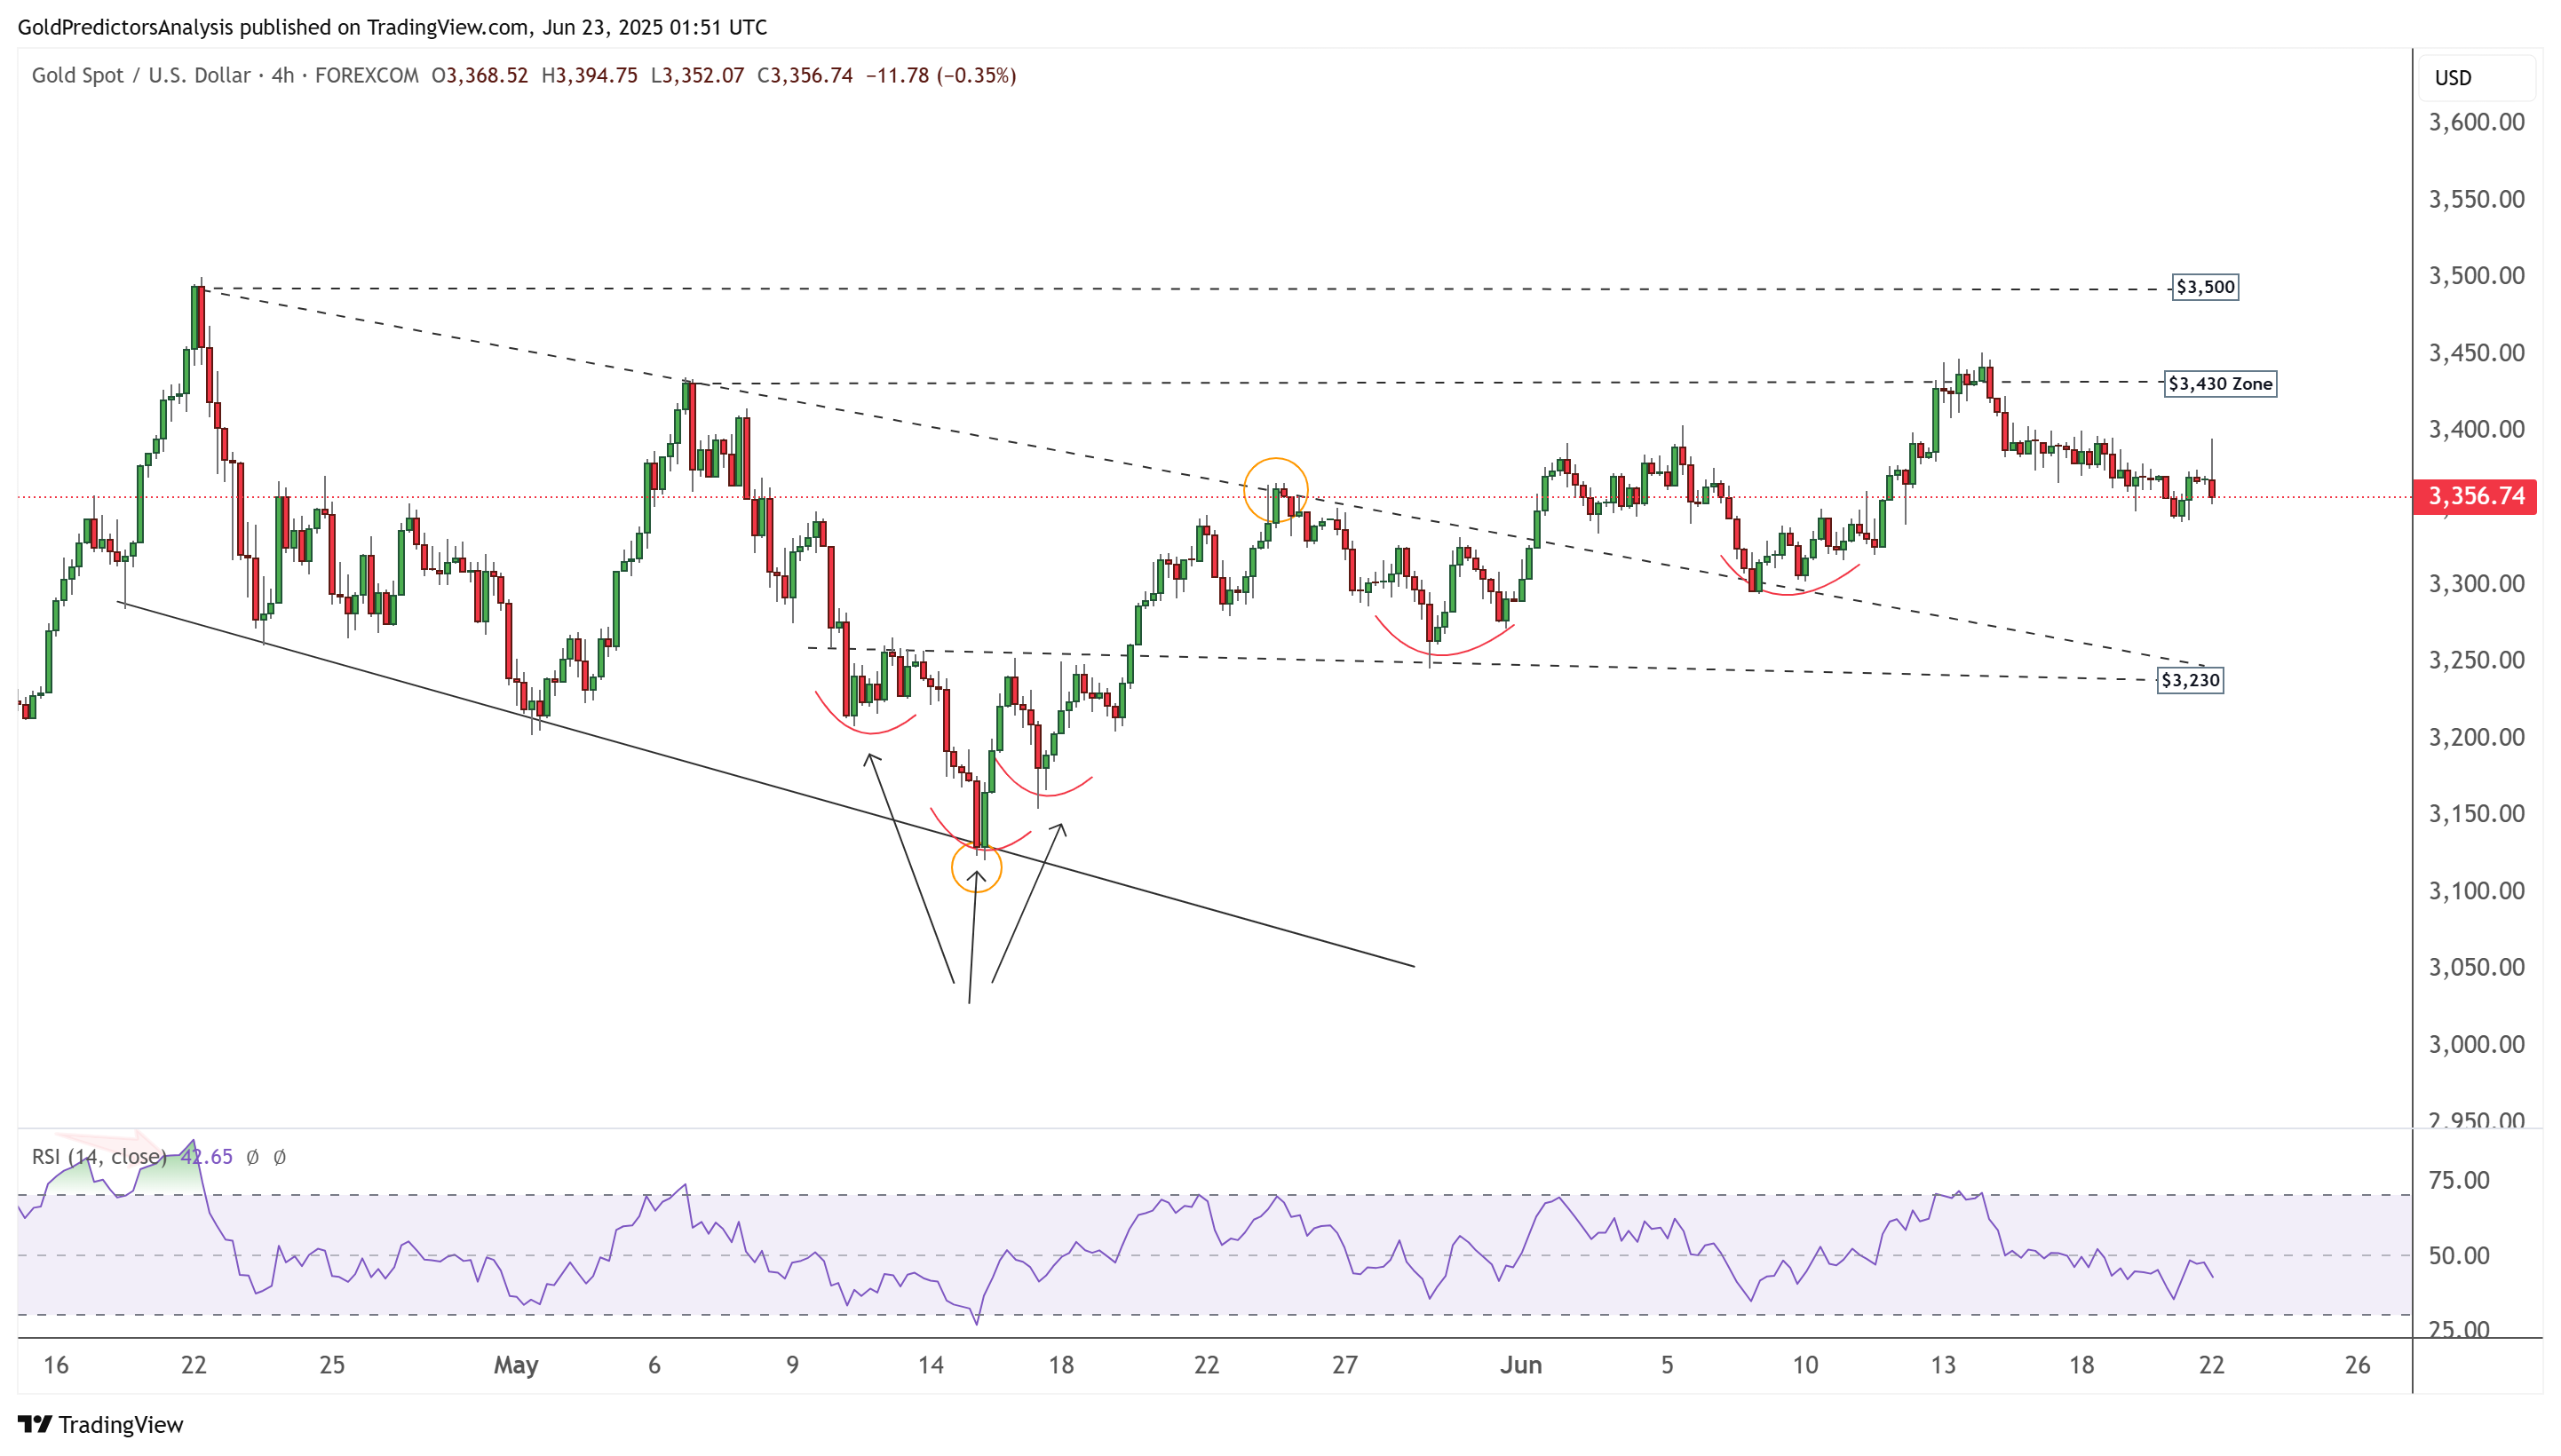
The 4-hour chart for spot gold shows that the price is consolidating below the $3,430 zone. A break above $3,430 could initiate a move toward the $3,500 area. As long as the price remains above $3,230, the upward bias is likely to continue.
Silver Technical Analysis
XAGUSD Daily Chart – Correction to $35
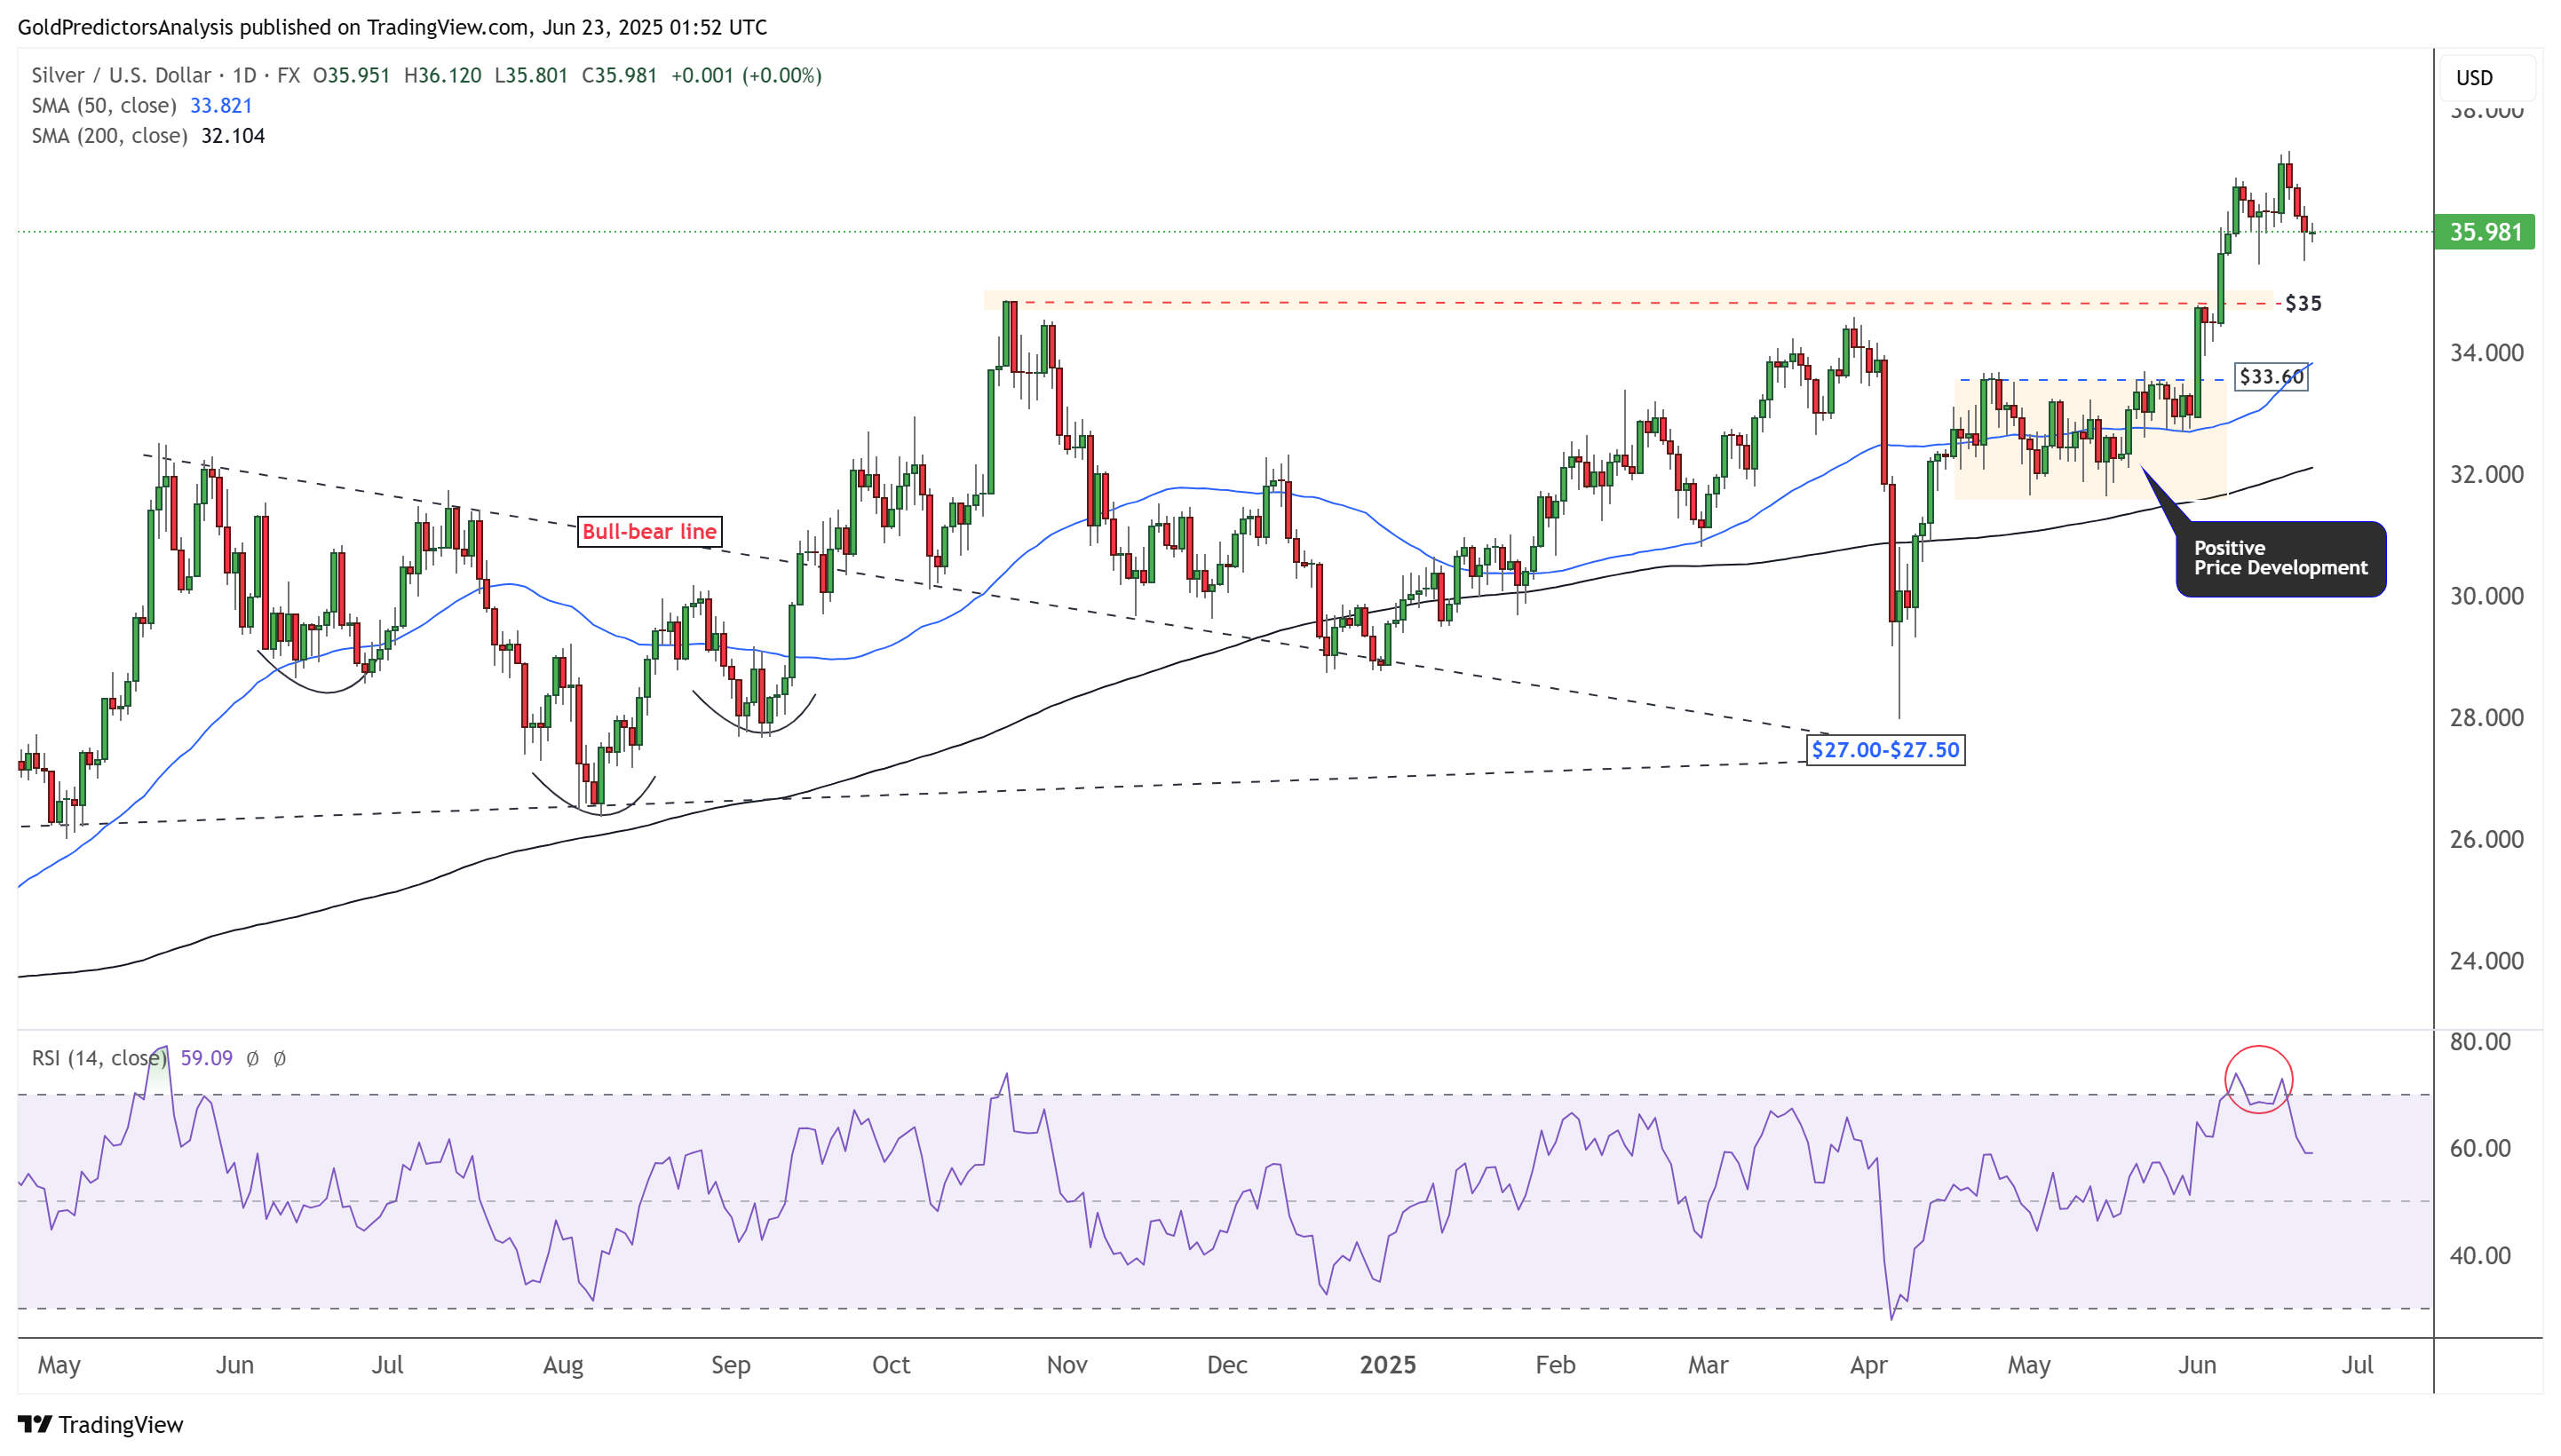
The daily chart for spot silver (XAG) shows that the price is consolidating after breaking above the $35 area. Following the breakout, the price moved higher but encountered strong resistance at $37, leading to a correction toward the $35 breakout level. This pullback is likely to find support around $35 and may initiate the next move toward the $40 level in spot silver.
XAGUSD 4-Hour Chart – Bullish Momentum
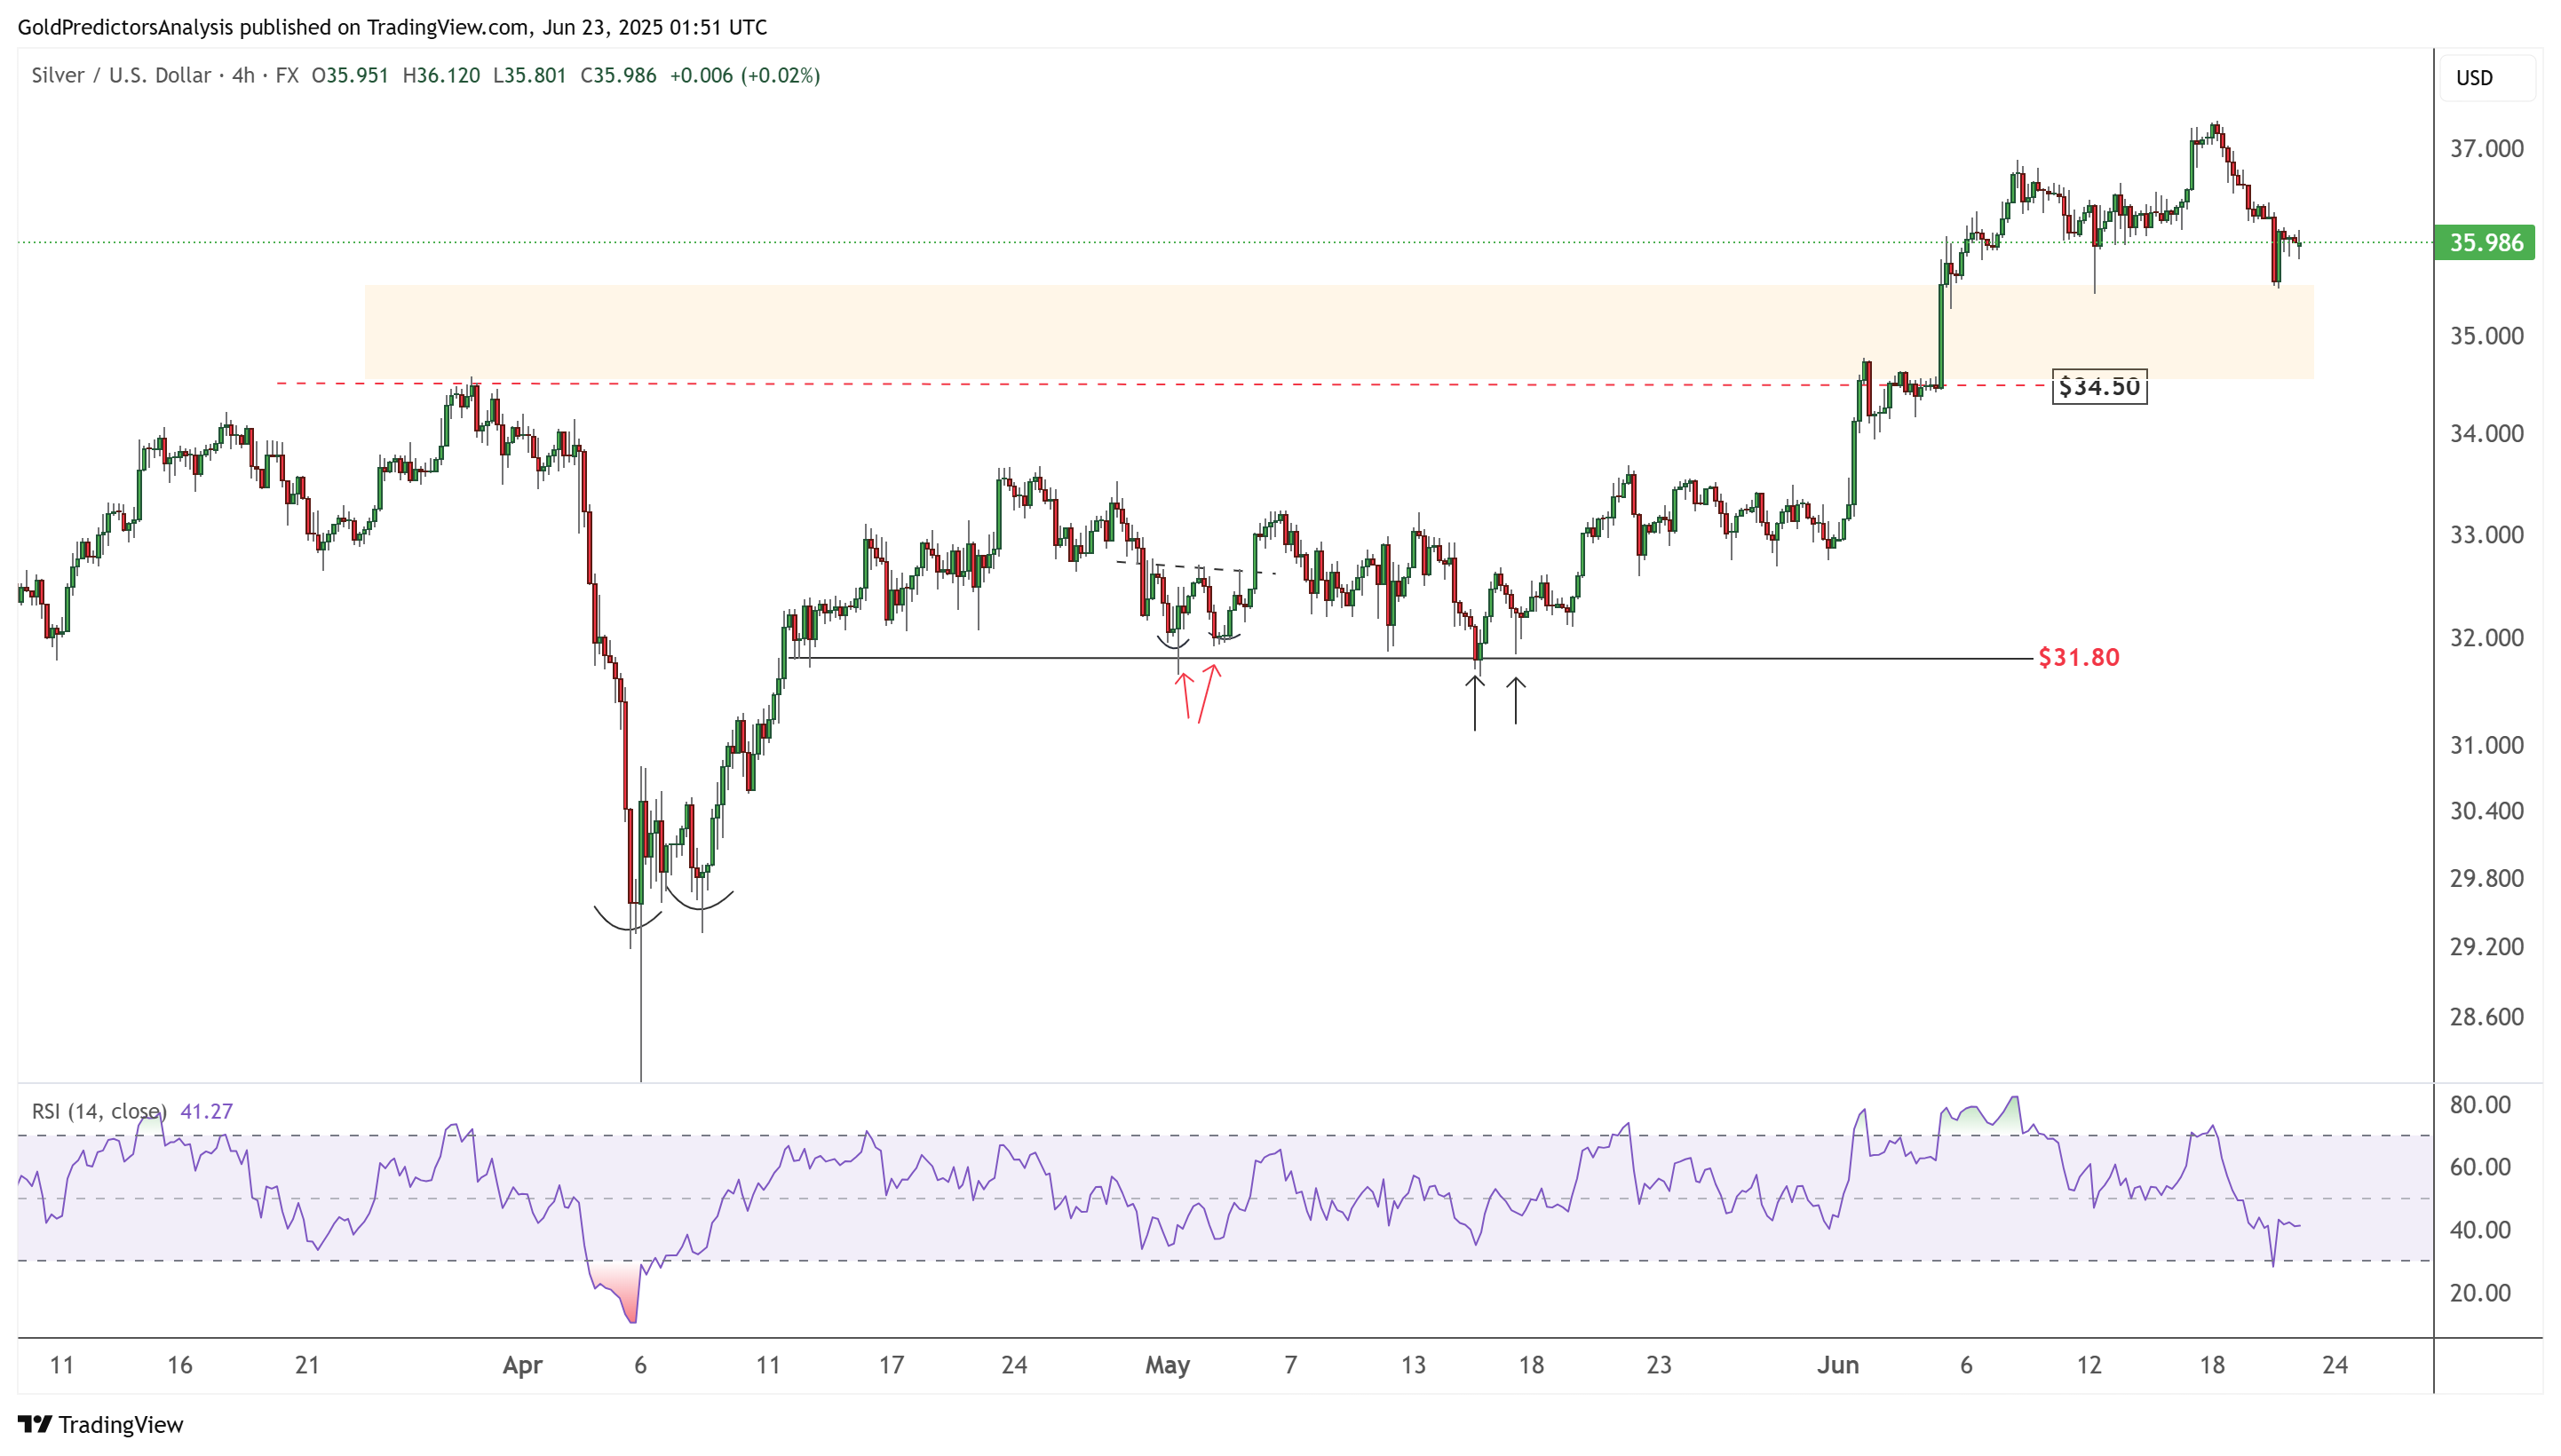
The 4-hour chart for spot silver also shows strong positive momentum building. The correction from the $37 level is approaching the support zone, highlighted by the orange area in the chart below. As long as the price remains above $34.50, the upward trend is likely to continue.
US Dollar Index Technical Analysis
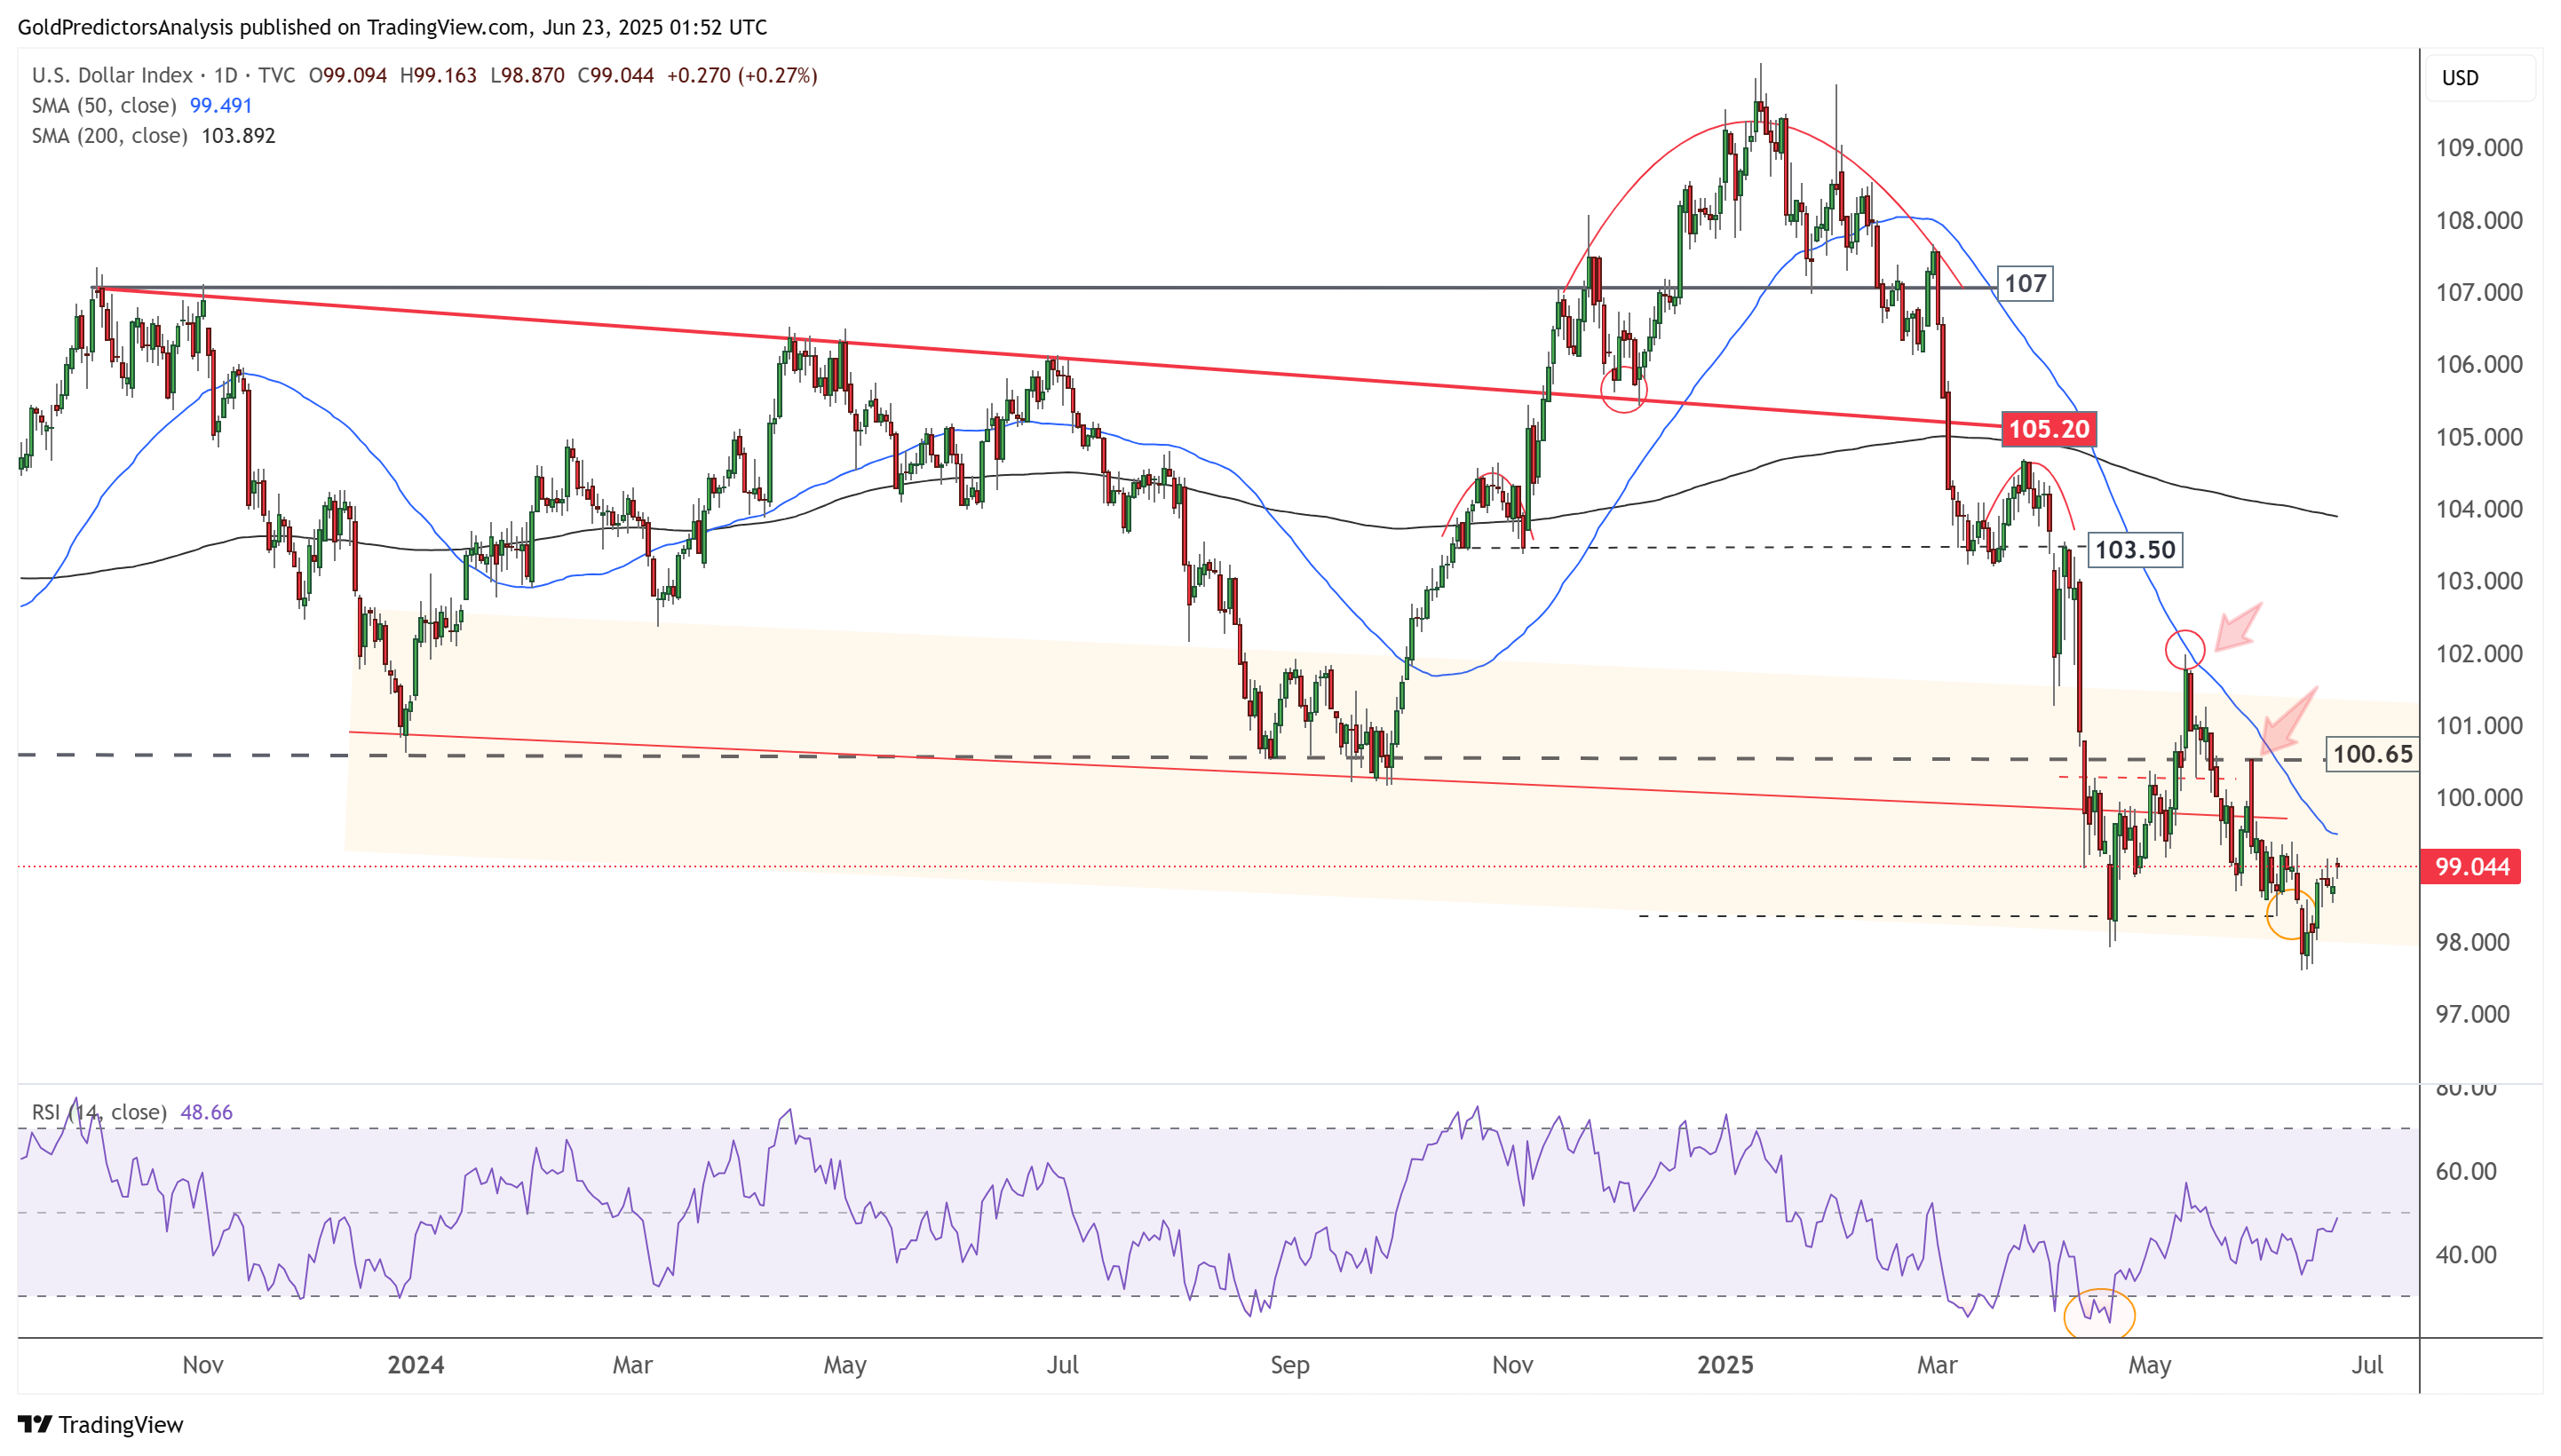
US Dollar Daily – Rebound
The daily chart for the US Dollar Index shows that it is trading within a strong negative trend. The index has failed to break below 98 and has initiated a rebound toward the 50-day SMA. As long as the index remains below 100.65, the downtrend is likely to continue. A break below 98 would trigger a move toward the 90 area.
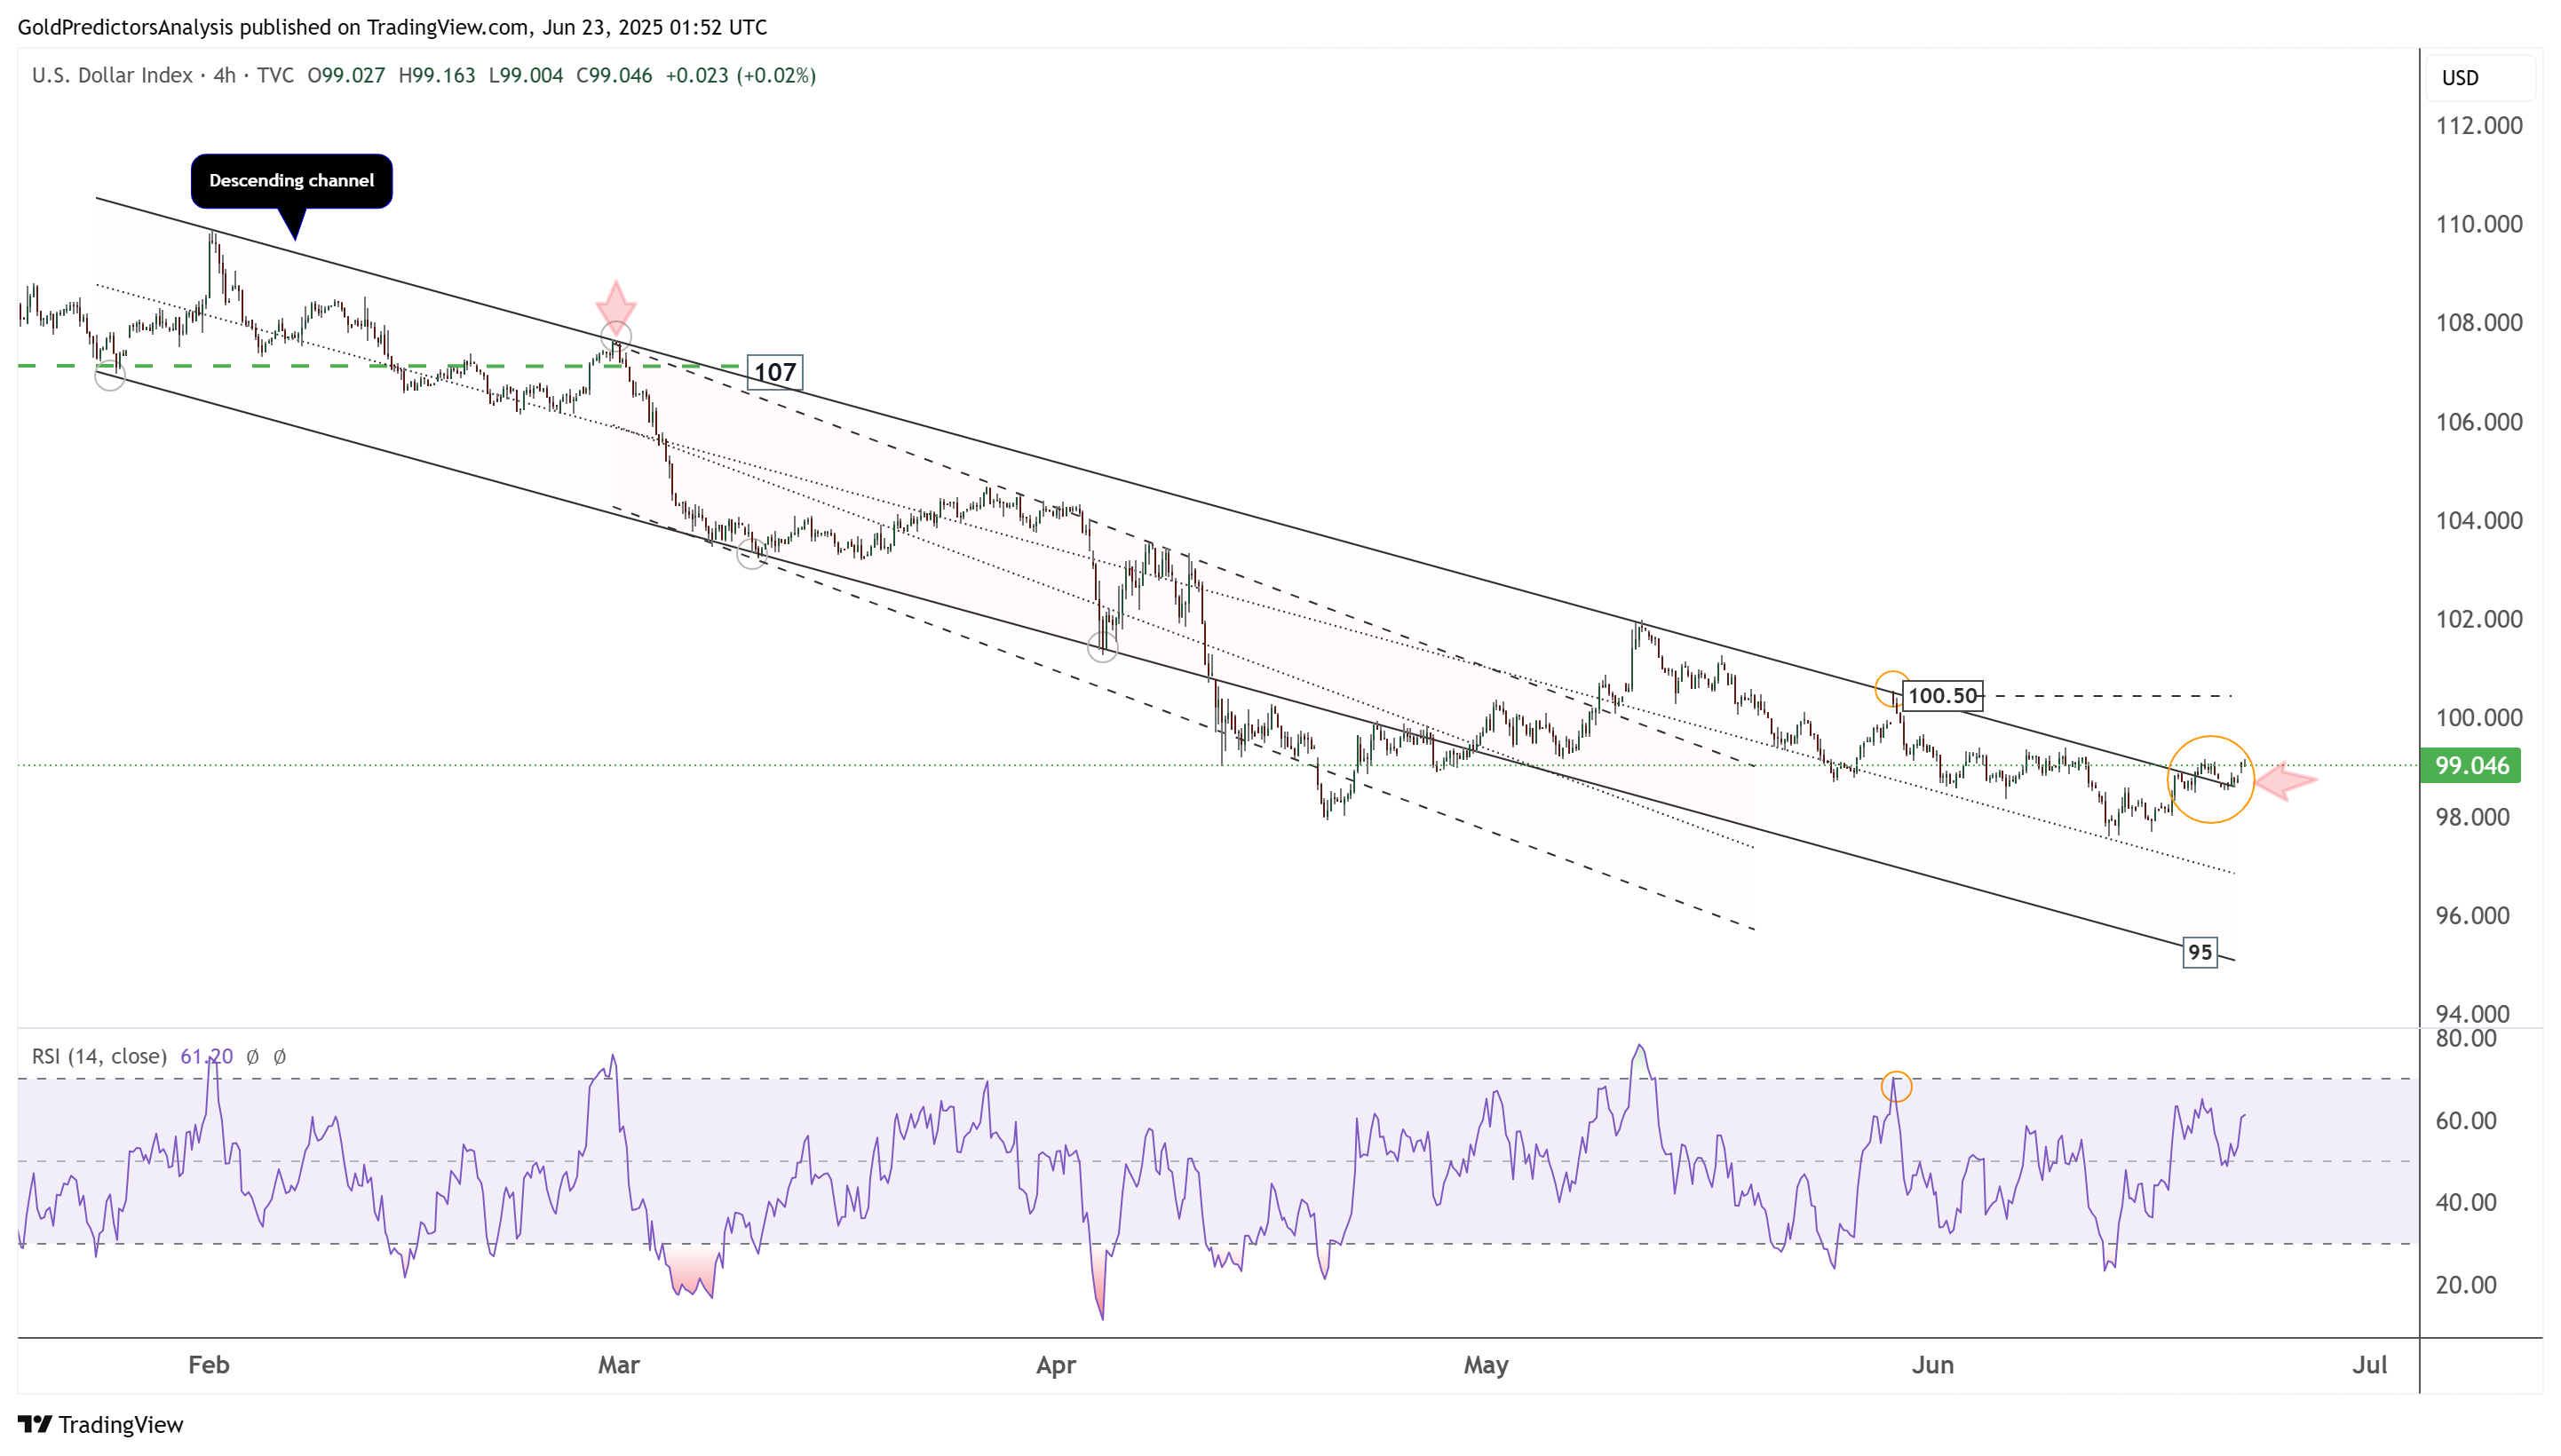
US Dollar 4-Hour Chart – Descending Channel
The 4-hour chart for the US Dollar Index shows that it is trading within a descending channel. The index is currently rebounding within this channel toward the 100.50 level. A break above 100.50 will indicate further upside in US dollar index.
About the Author
Bob MasonChief Crypto Boss
123456789 30 He has written extensively for a broader audience and his current focus is on developments relating to the financial markets including, but not limited to currencies, commodities, alternative asset classes, and global equities.


Advertisement