
Advertisement
Advertisement
Gold (XAUUSD) and Silver Technical Analysis: Resistance Levels and Fed Decision in Focus
By:
Key Points:
- Gold (XAUUSD) pulls back from the $3,450 resistance level.
- Silver (XAGUSD) finds strong support at $35.50 and continues to move higher.
- US Dollar Index (DXY) rebounds from 98 but remains below the 50-day SMA.

Gold (XAUUSD) consolidated below $3,400 on Tuesday as the US Dollar rebounded. The price is hovering around $3,380 after facing resistance near $3,450. The pullback followed the release of mixed US retail sales data. The market now awaits the Federal Reserve’s decision on Wednesday, which may determine the direction of gold’s next move.
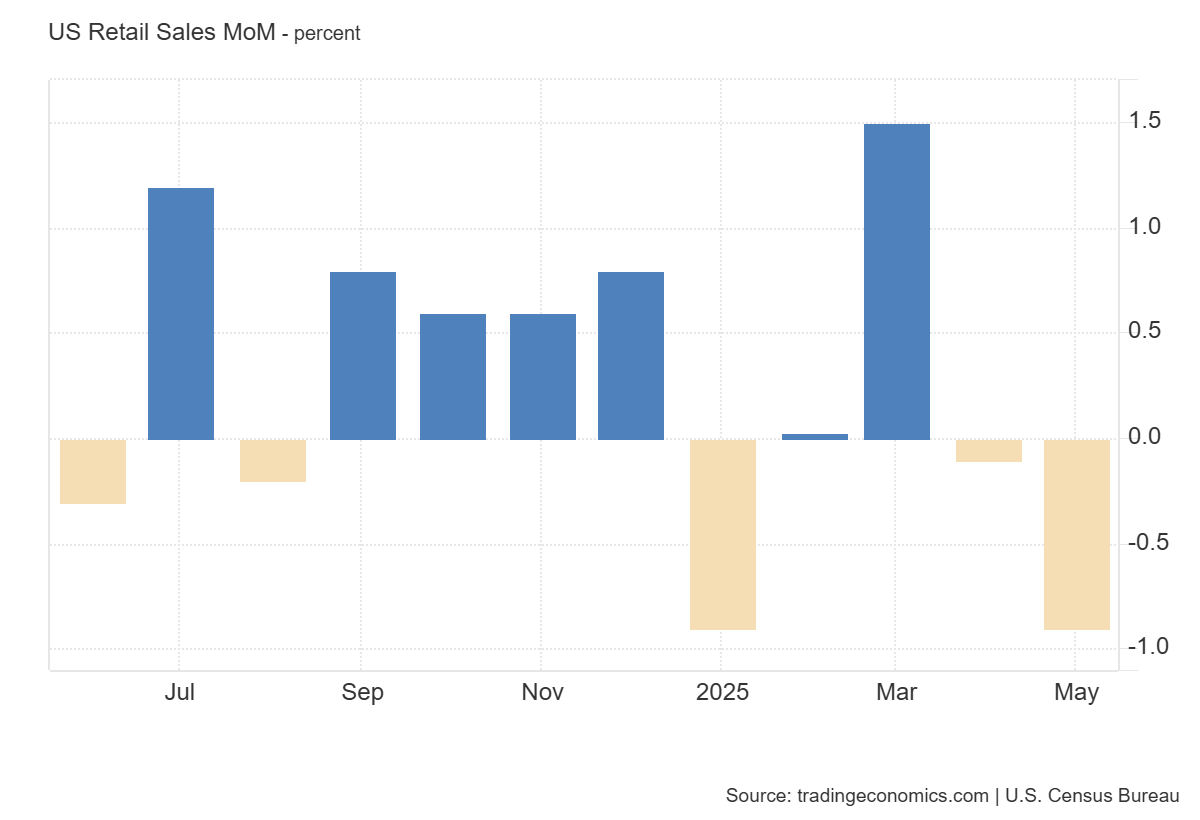
US retail sales dropped 0.9% in May, coming in worse than expected. Meanwhile, sales excluding autos declined by 0.3%. The mixed data complicates the Fed’s outlook. While weak headline numbers support future rate cuts, stronger internal data could delay easing.
At the same time, geopolitical tensions continue to support gold’s safe-haven appeal. Iran’s ongoing missile and drone attacks on Israel, along with growing threats to the Strait of Hormuz, have renewed fears of a broader war. These crises have triggered strong volatility in financial markets, driving increased demand for gold as a safe-haven asset.
The Fed’s Summary of Economic Projections and dot plot will be crucial on Wednesday. If the Fed maintains a cautious stance or reduces expectations for rate cuts, gold could face resistance. However, a dovish shift could push XAUUSD back toward $3,450 and beyond. The market remains highly sensitive to central bank signals and geopolitical developments.
Gold Technical Analysis
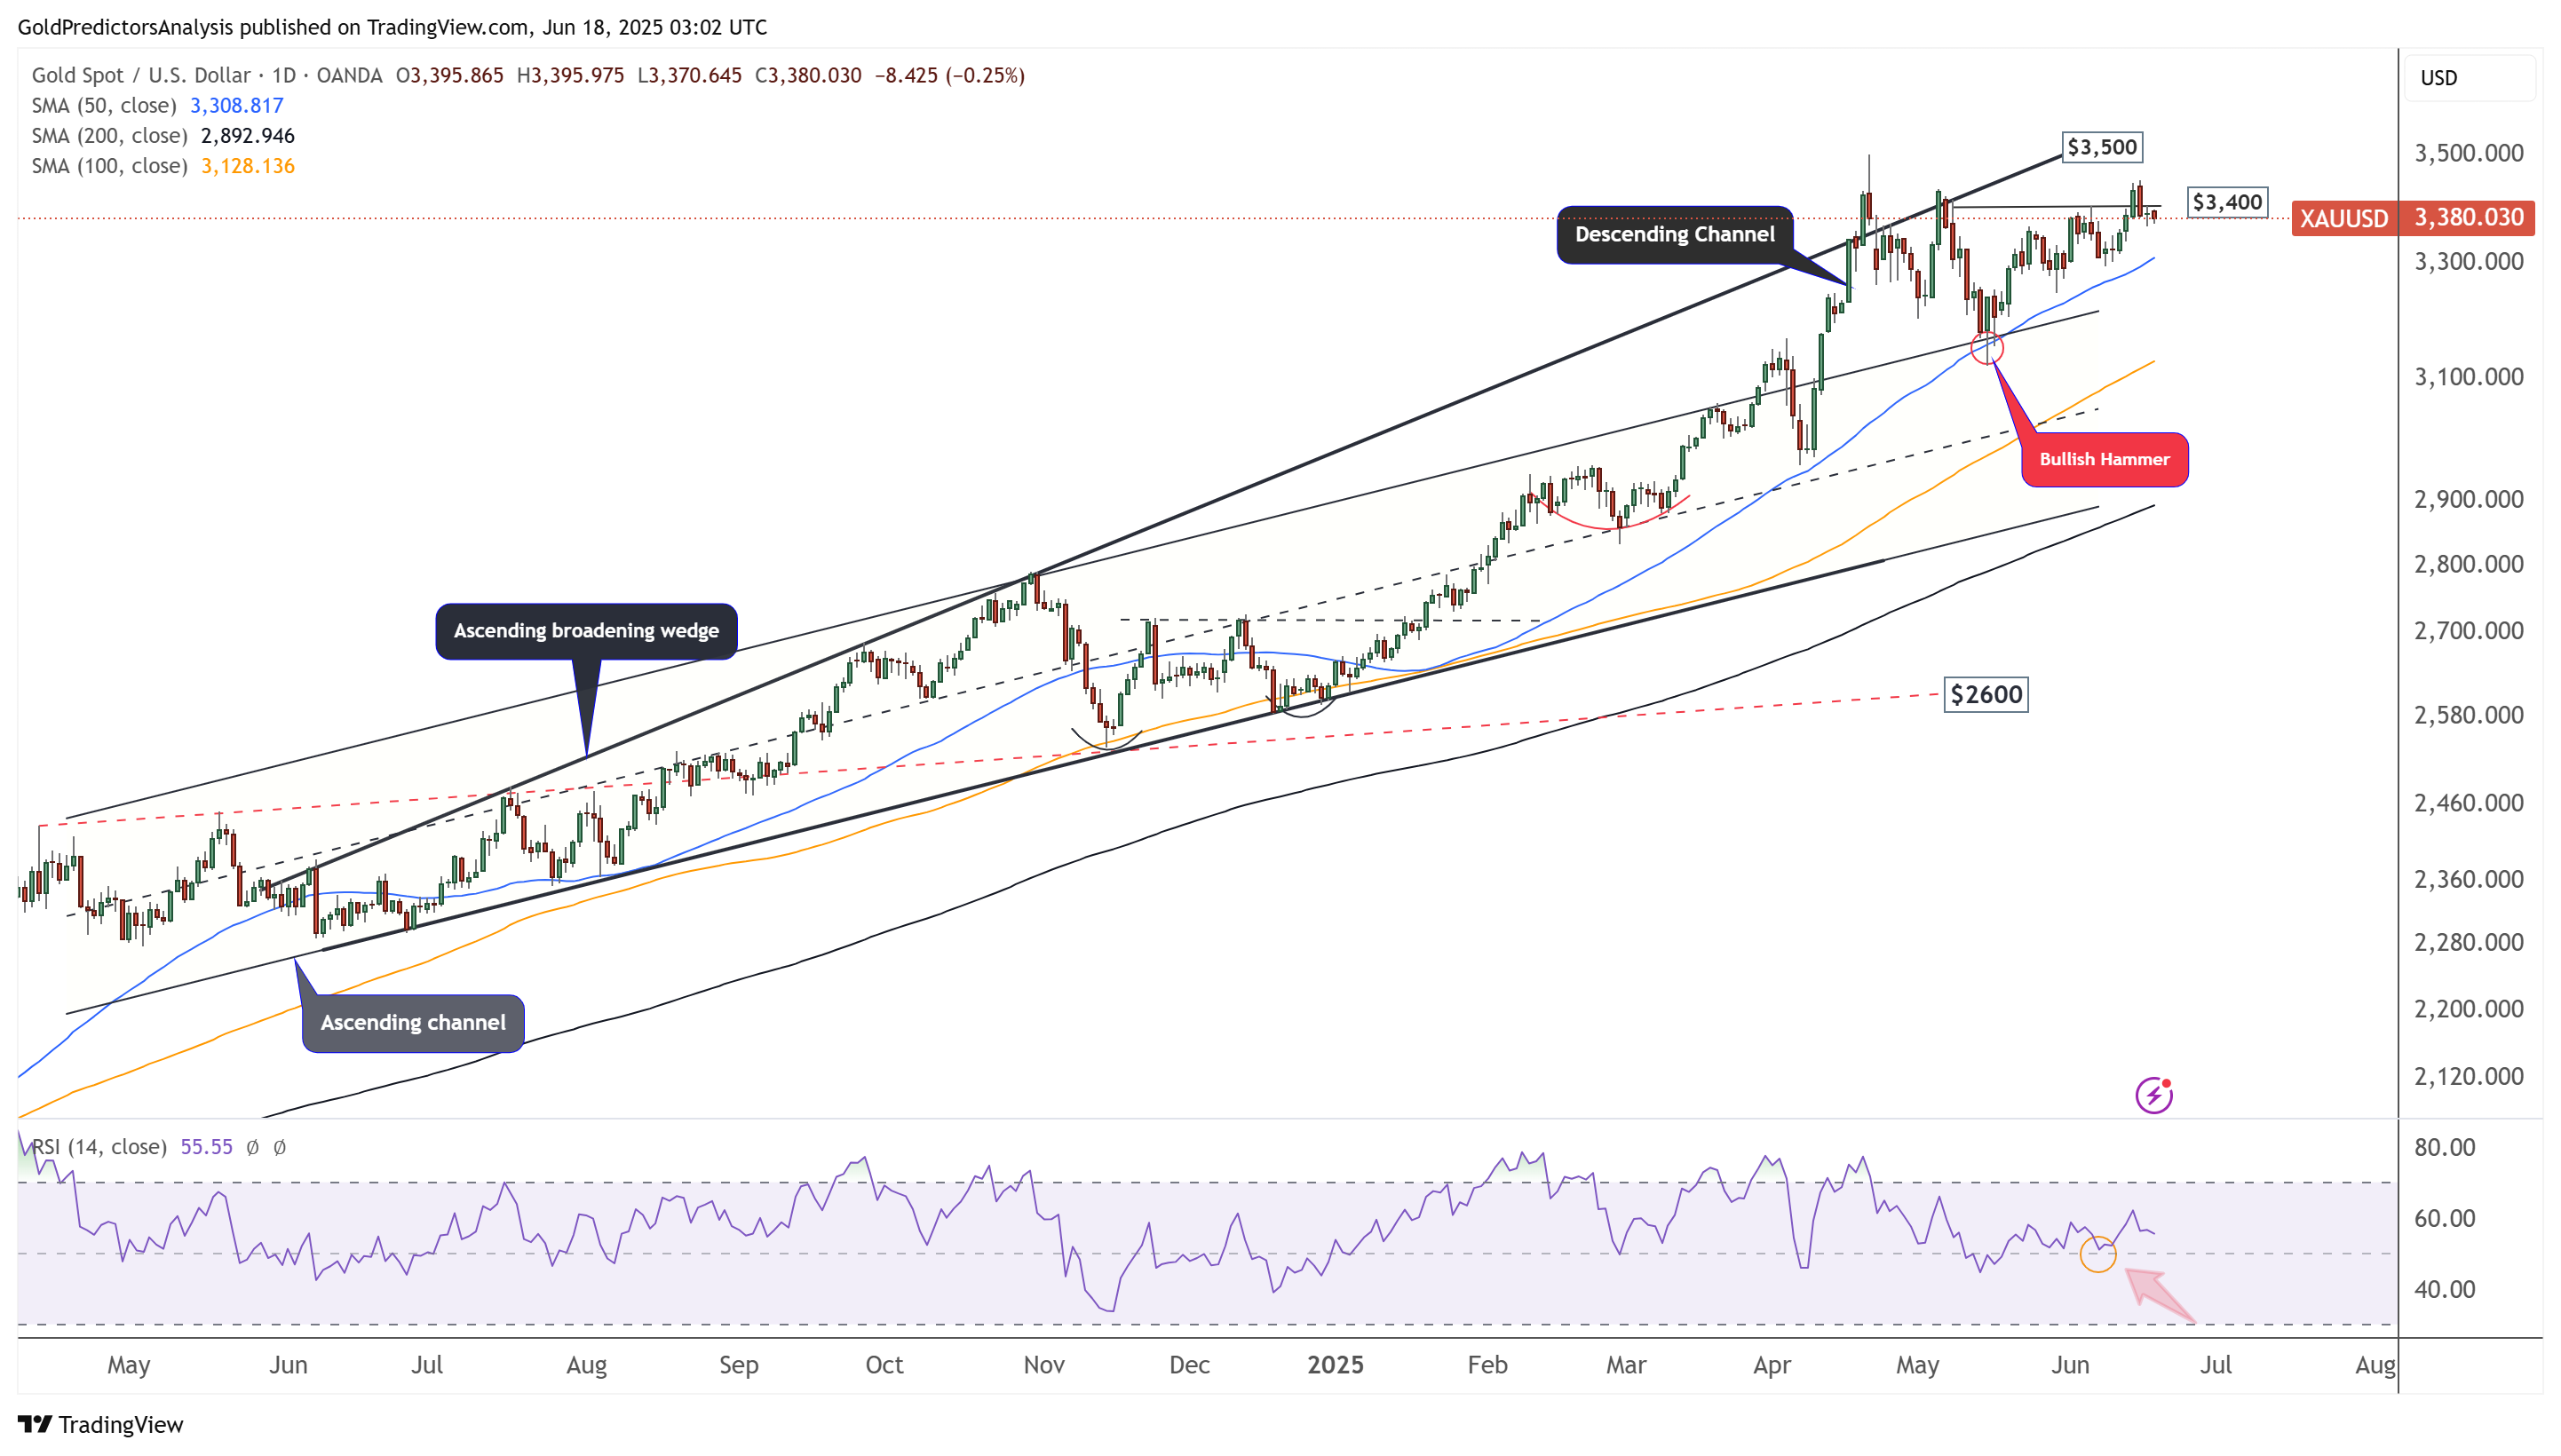
XAUUSD Daily Chart – Correction from Key Resistance of $3450
The daily chart for spot gold shows that the price broke above $3,400 last week but failed to sustain the rally, pulling back on Monday. The price is now consolidating in a range and showing signs of uncertainty ahead of a potential break above the $3,500 region. Despite this, the overall trend remains positive as the price stays above the 50-day and 200-day SMAs. Gold is approaching the 50-day SMA, and the outlook remains bullish as long as it holds above key support levels.
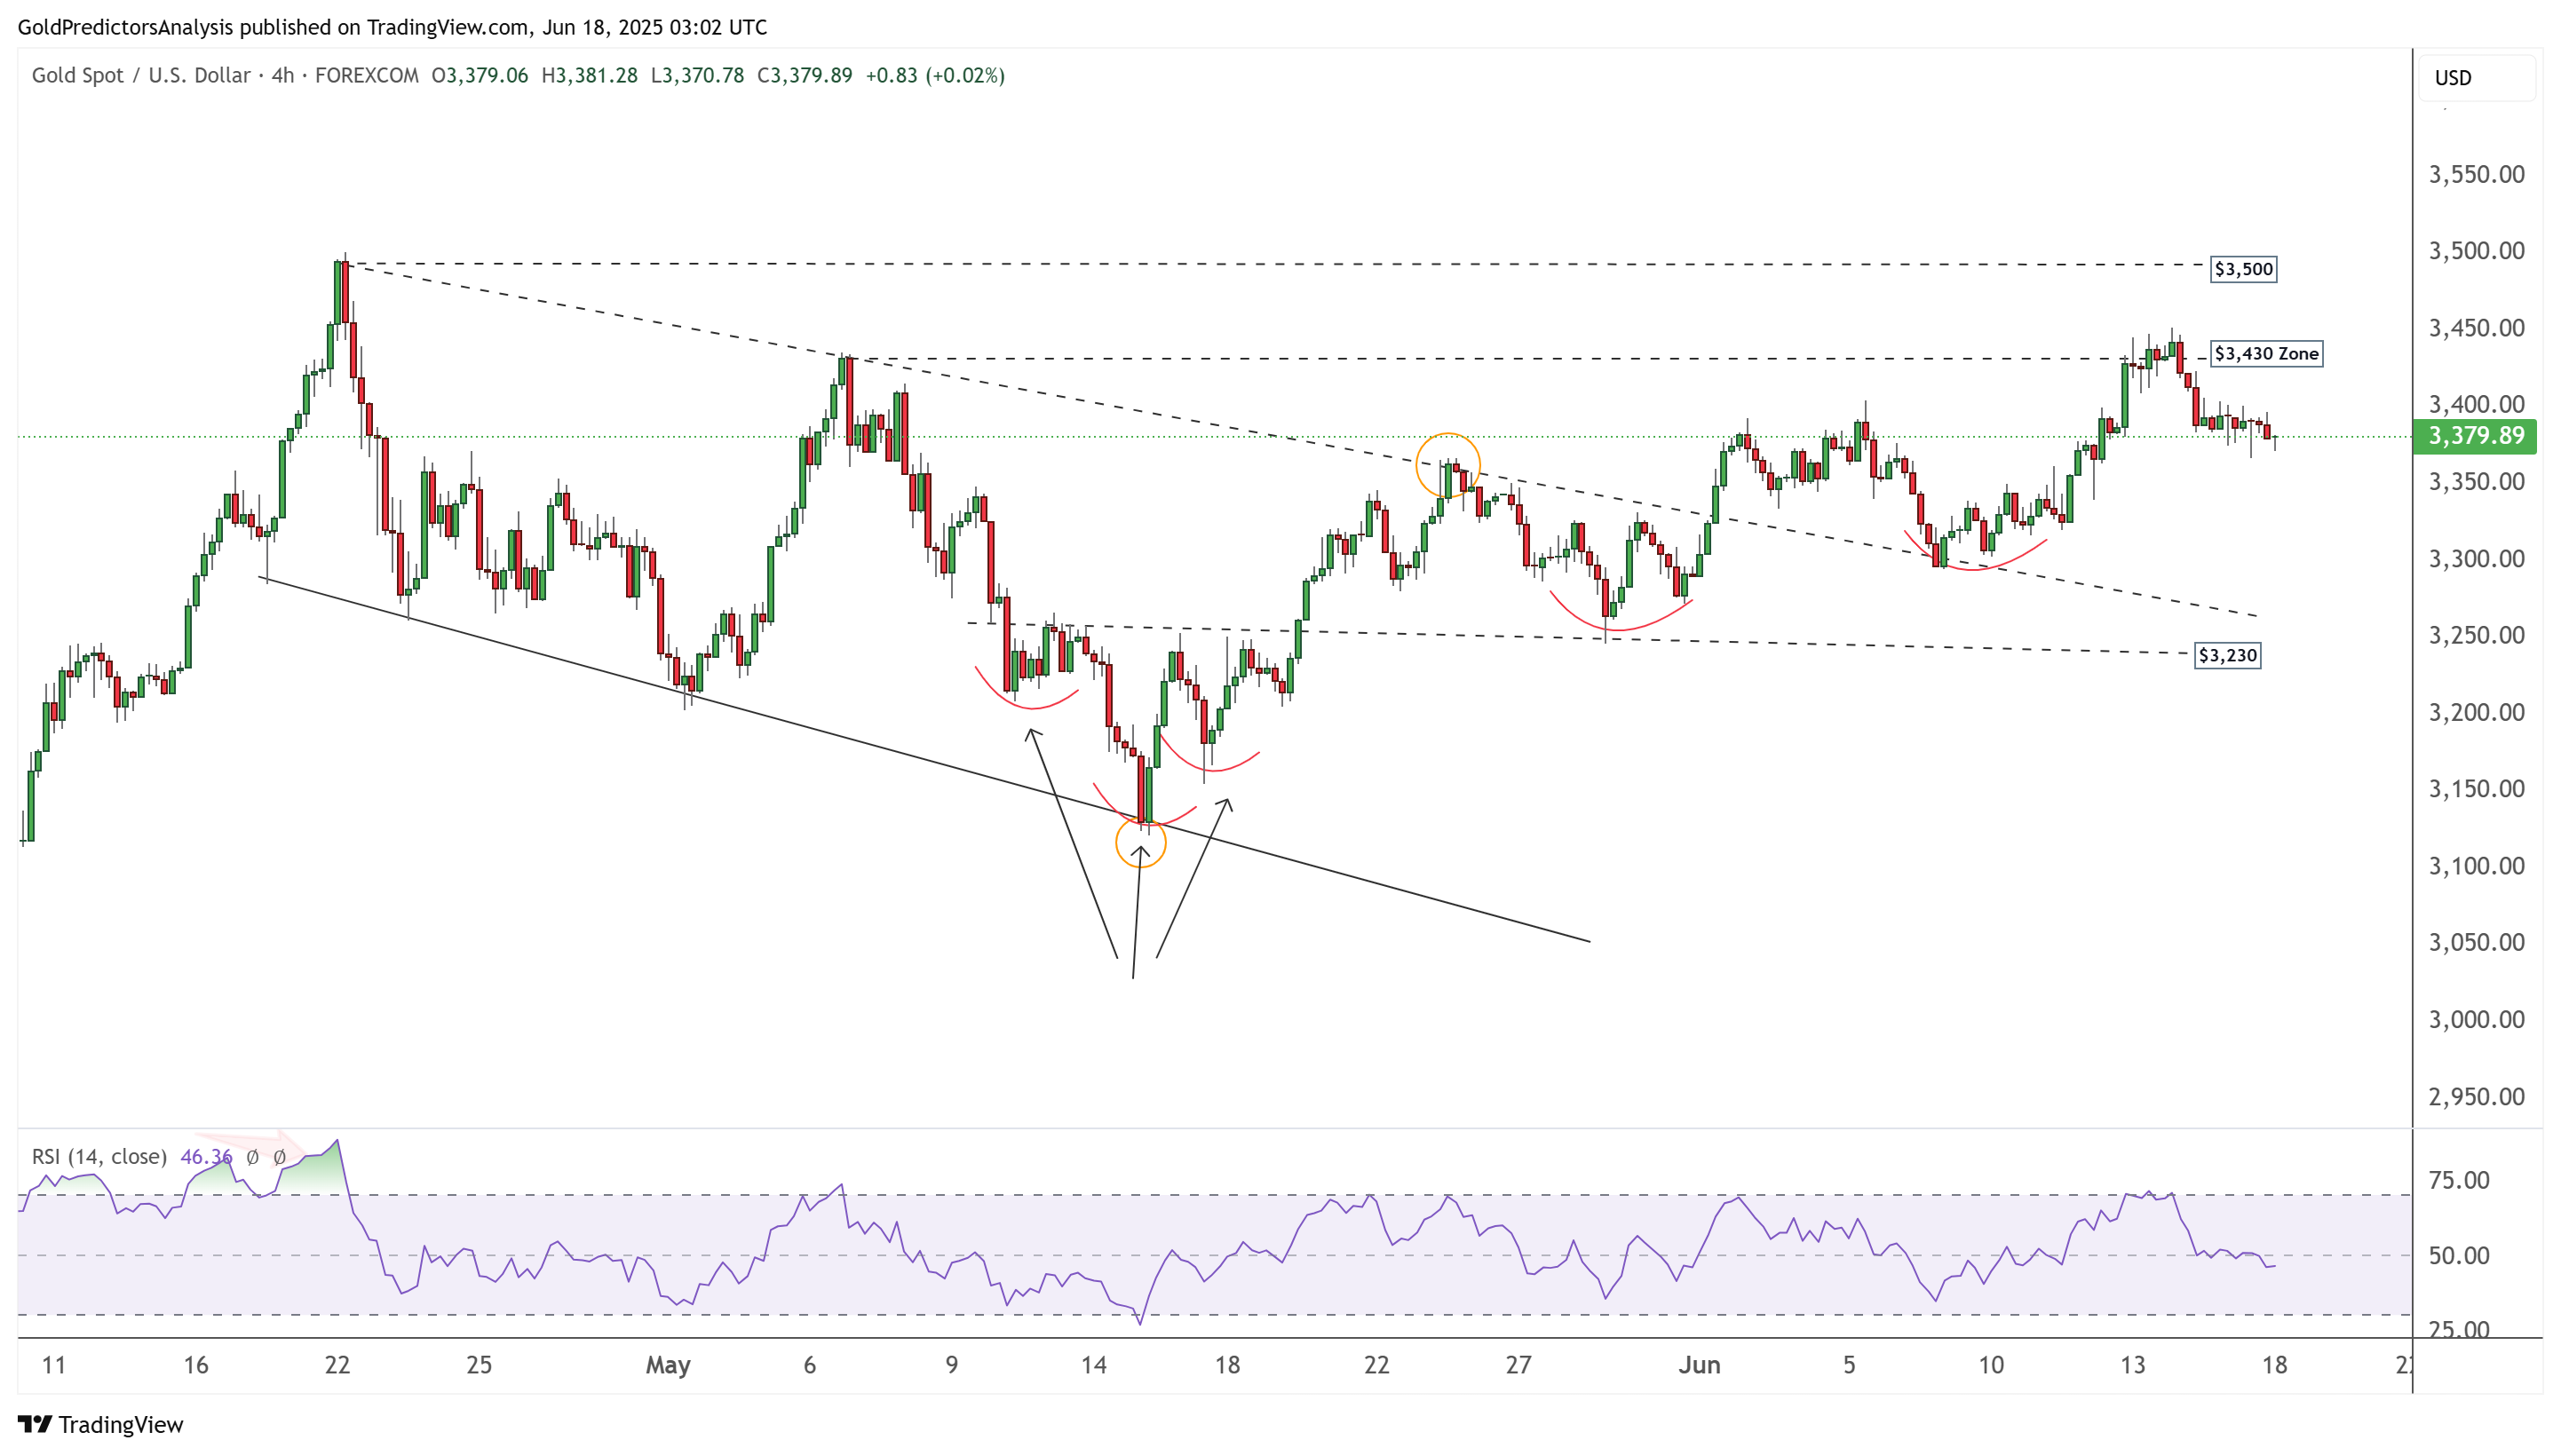
XAUUSD 4-Hour Chart – Consolidation Ahead of Fed Decision
The 4-hour chart for spot gold shows that the price failed to break above the $3,450 area and began a correction. Despite this pullback, the overall price structure remains bullish, supported by the formation of multiple rounding bottoms. Additionally, the emergence of an inverted head and shoulders pattern near the $3,120 area suggests that the price is likely to remain elevated.
Silver Technical Analysis
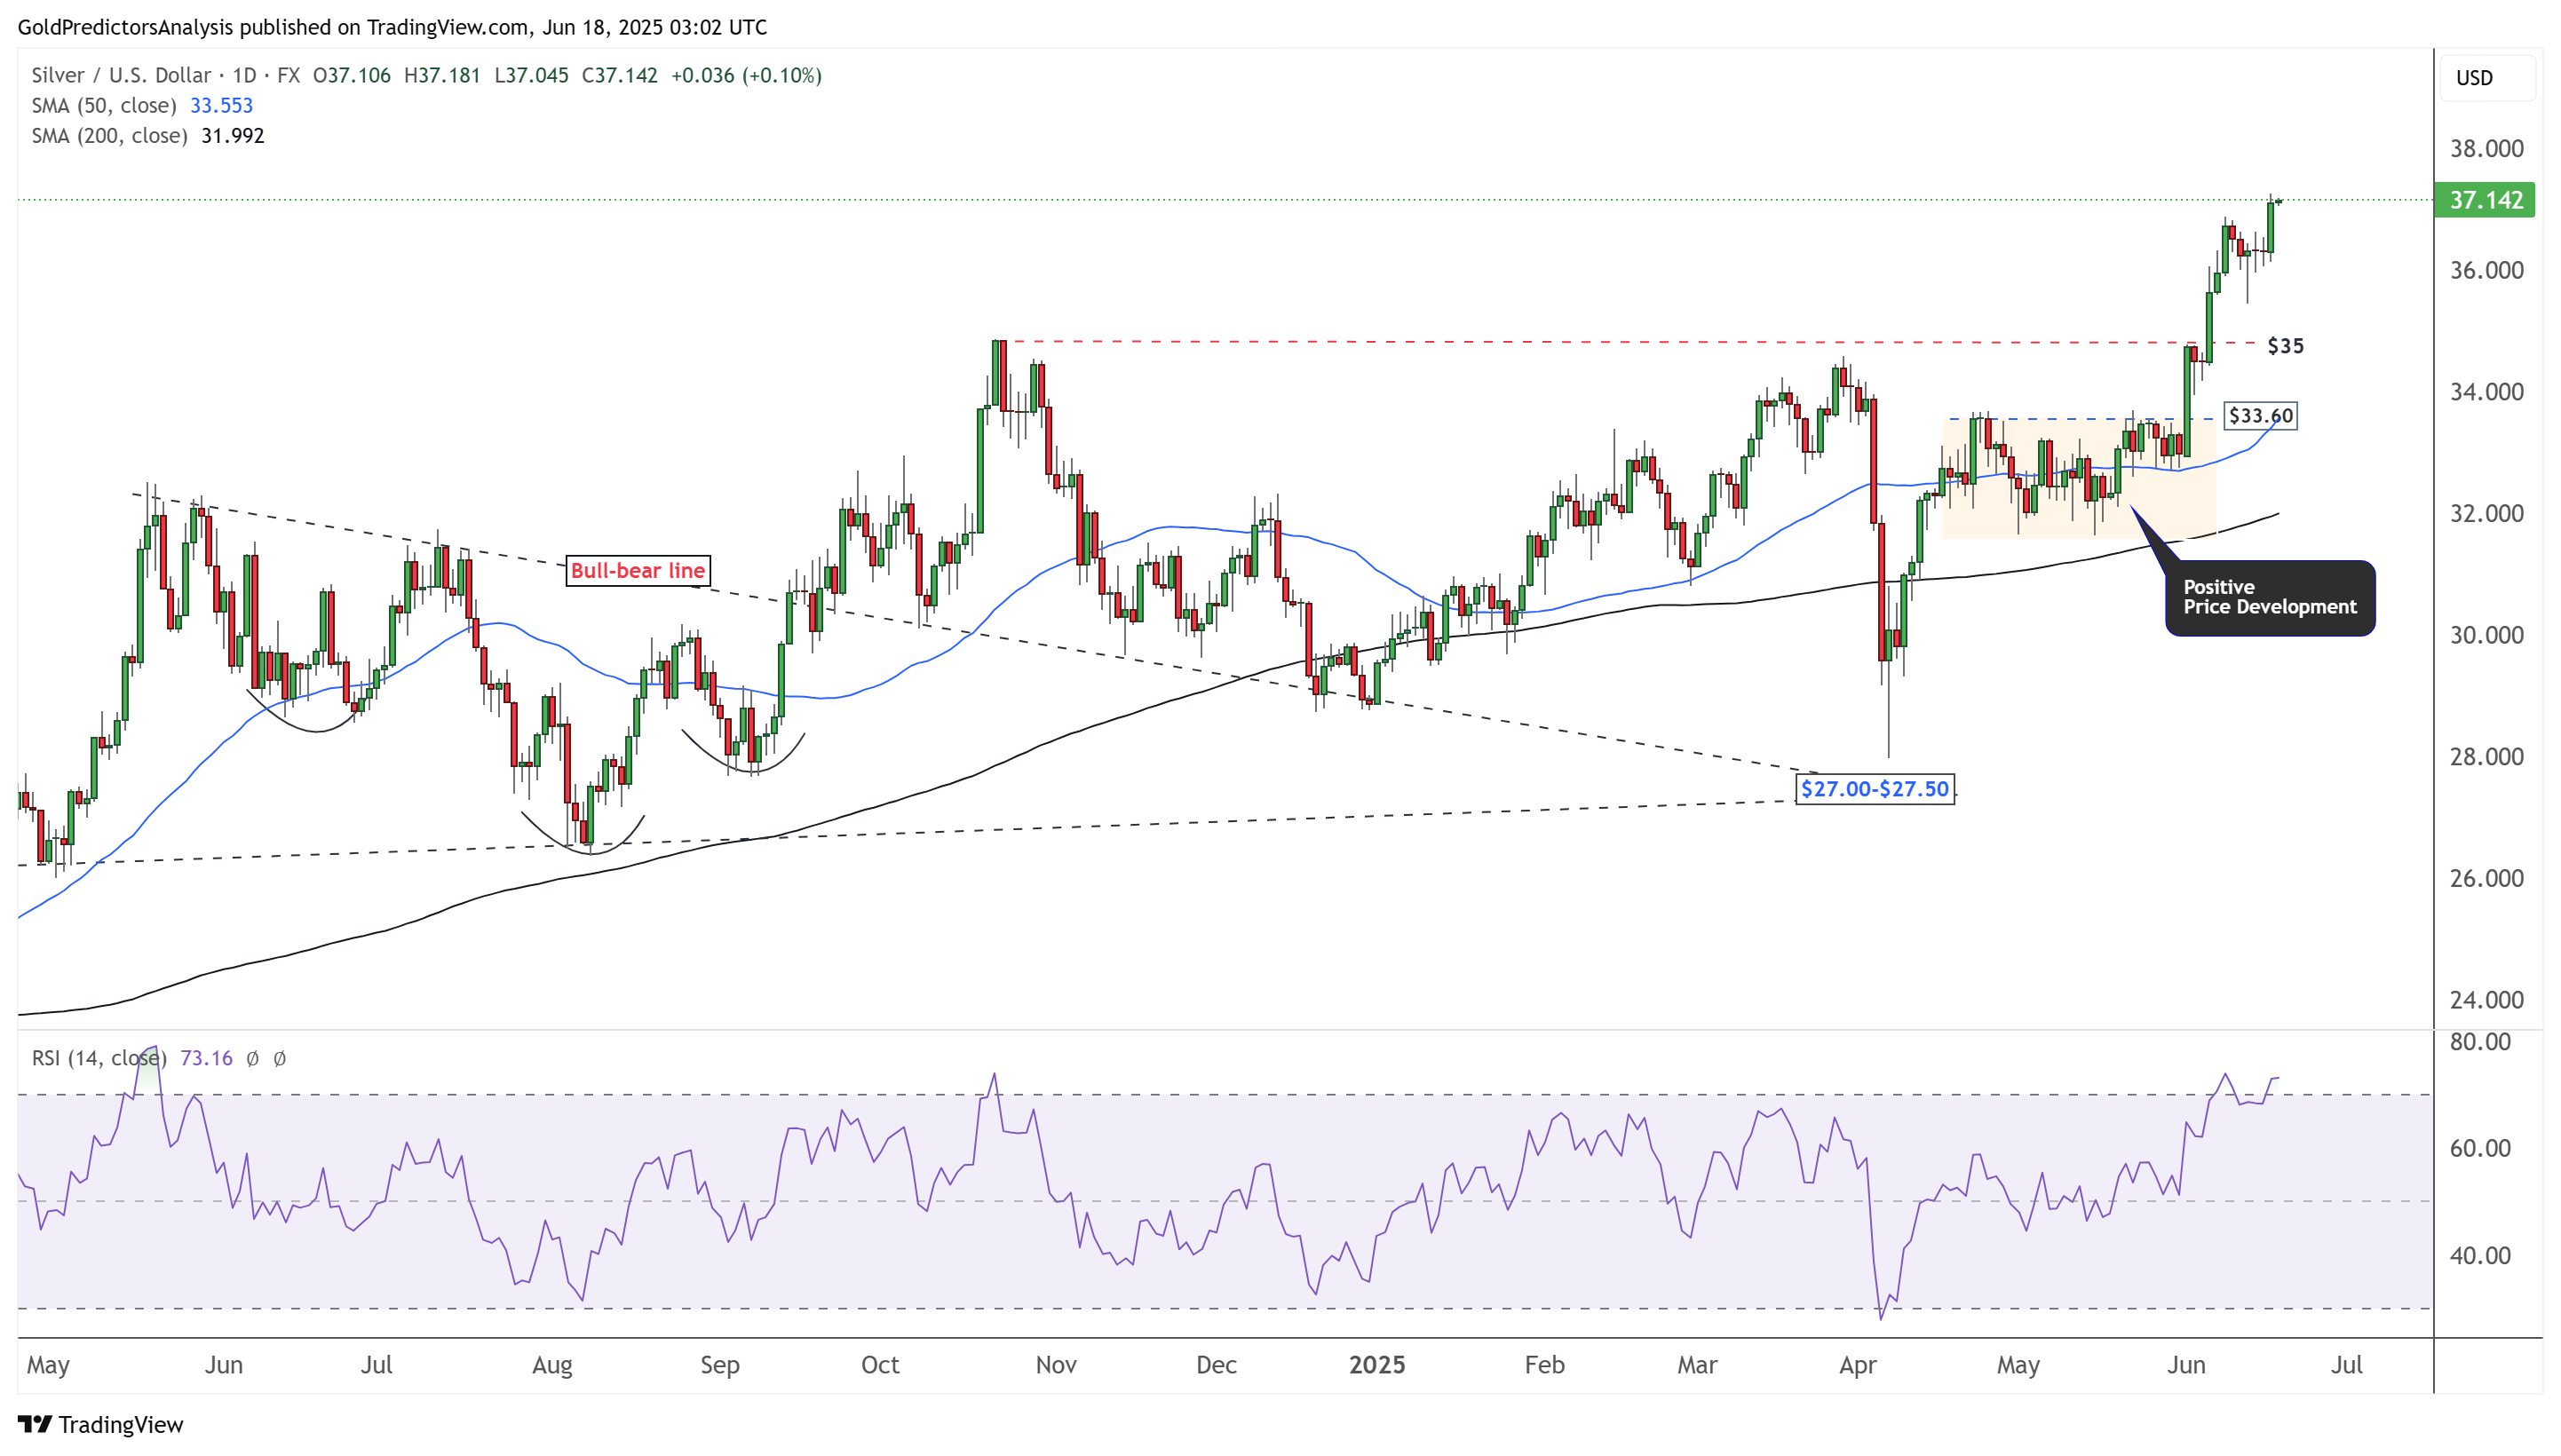
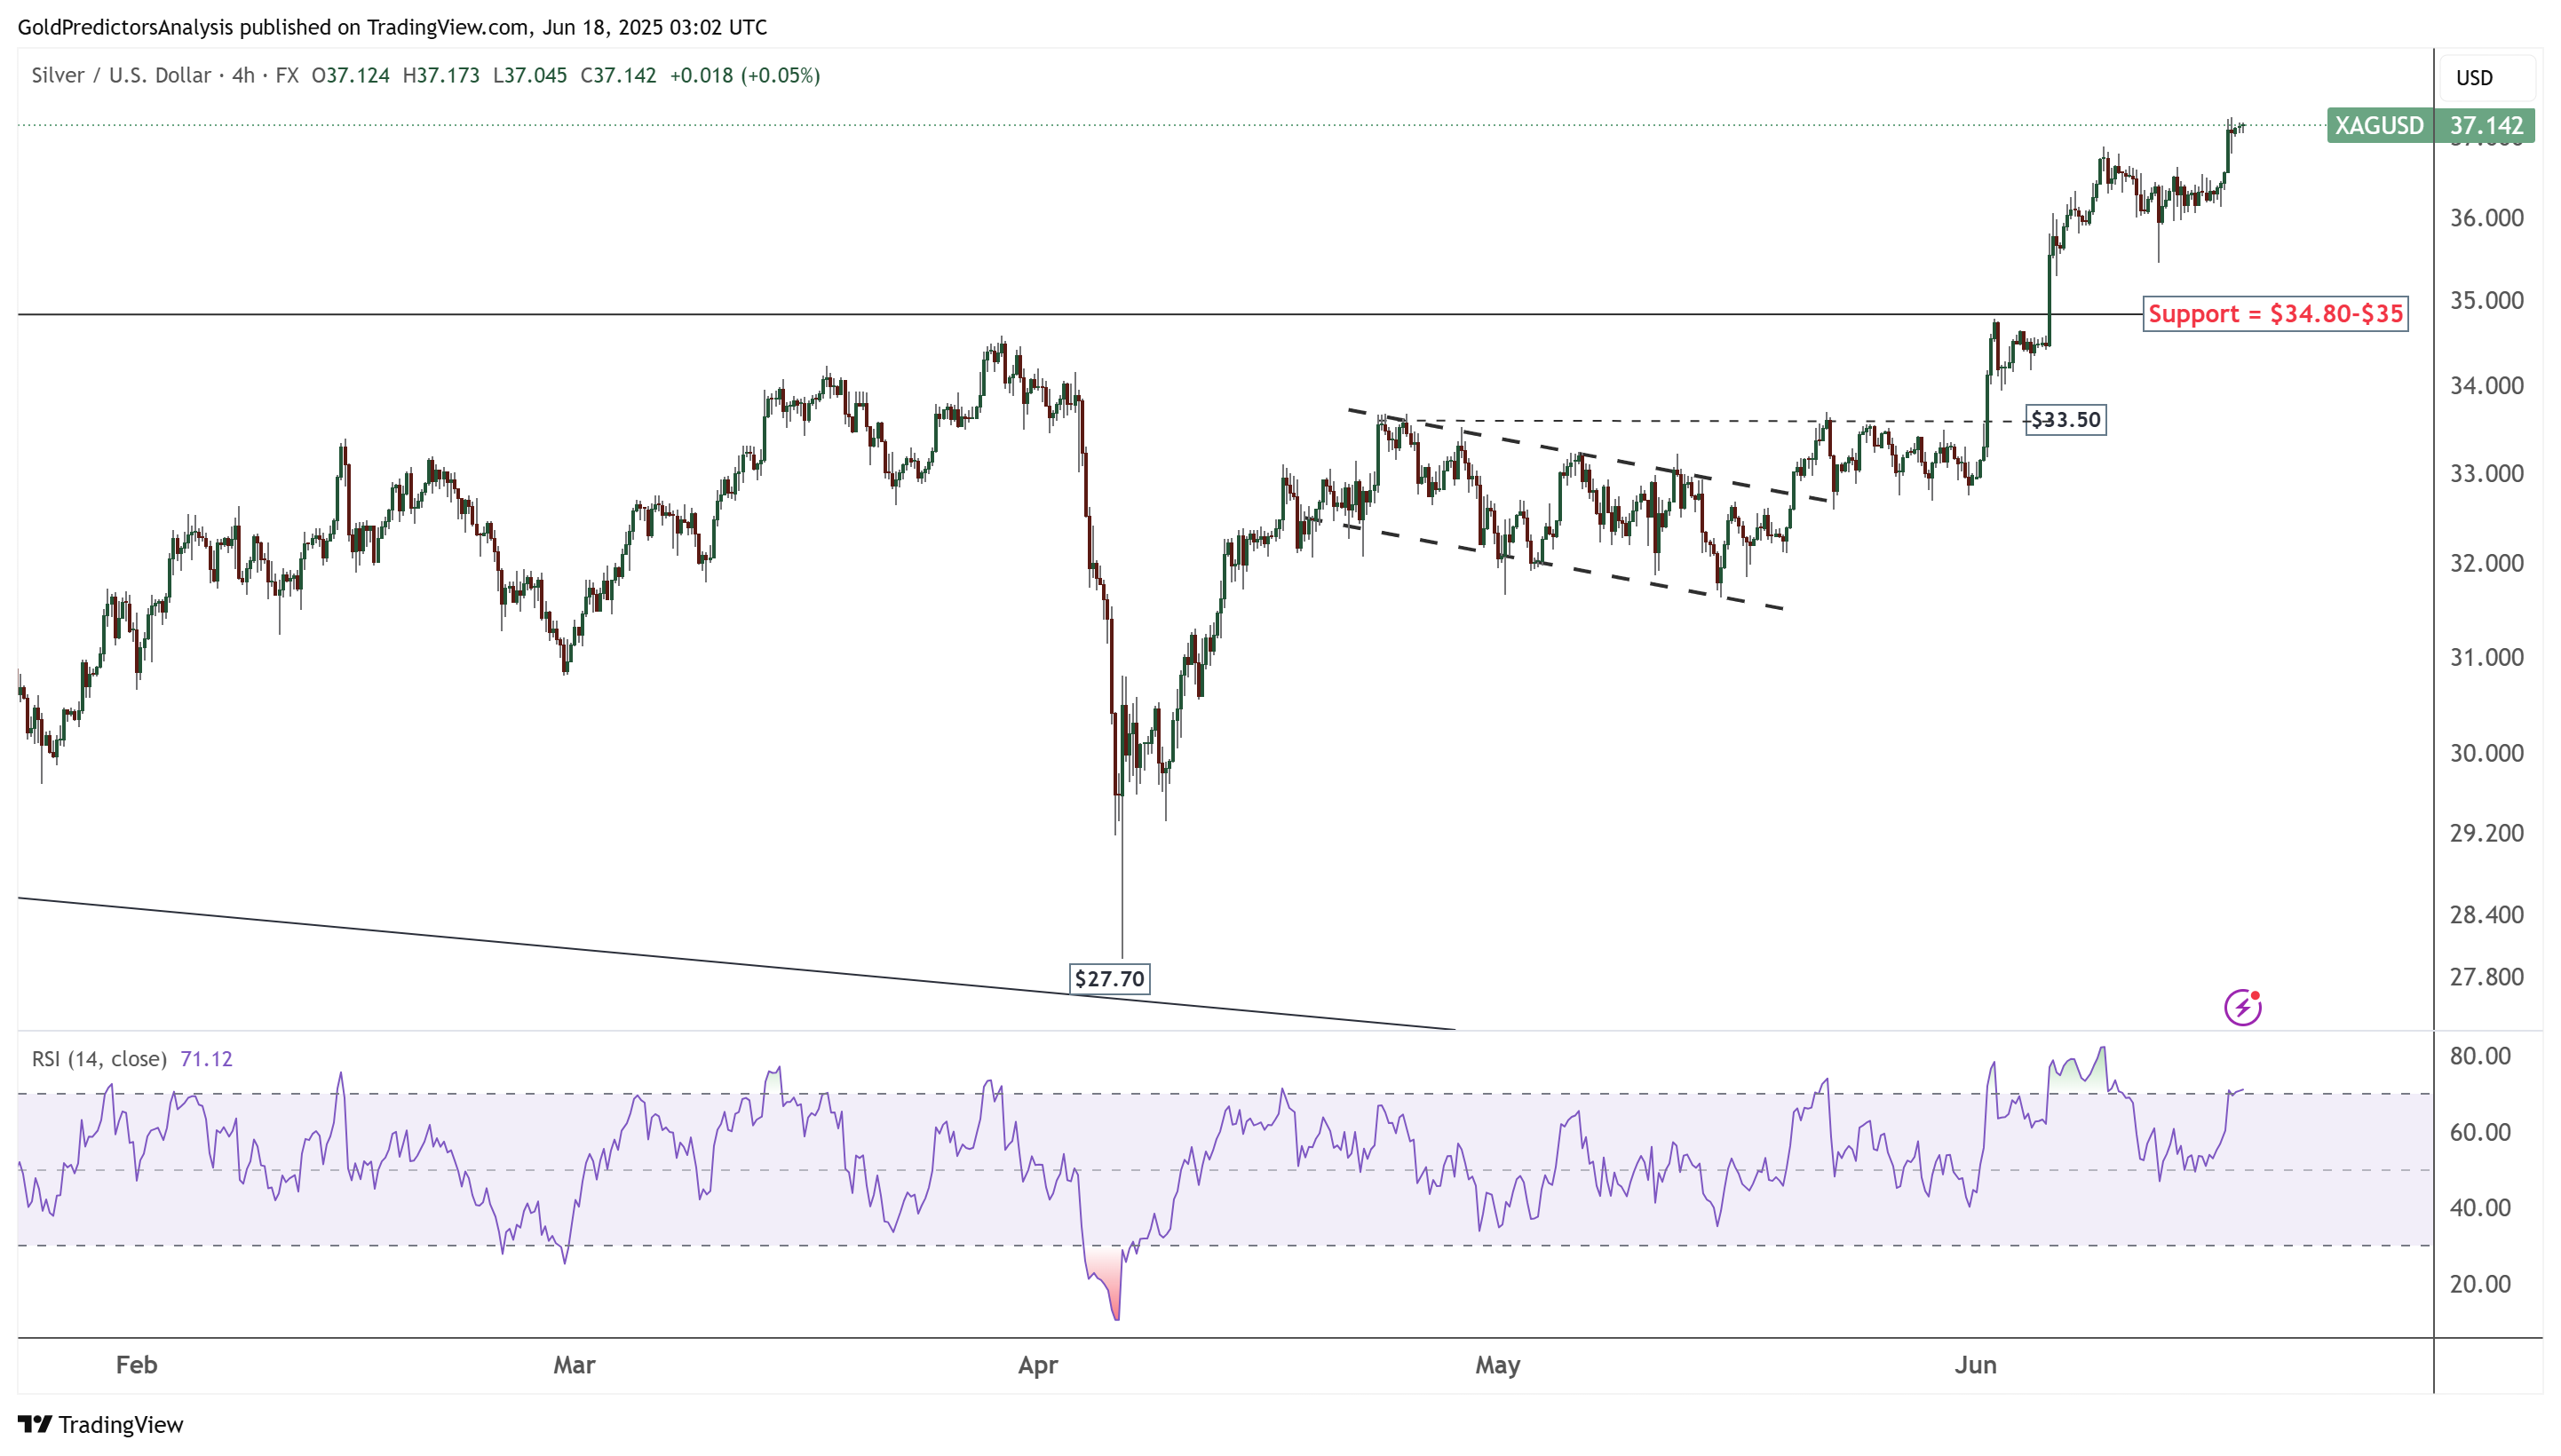
XAGUSD Daily Chart – Break above $35
The daily chart for spot silver shows that the price continues to rally above the $36 level. The consolidation between the $33.60 and $31.60 range has broken to the upside, triggering strong bullish momentum. As long as the price stays above the $35 area, the bullish trend is likely to continue. However, the RSI indicates overbought conditions on the daily chart, suggesting a possible short-term correction before the next move higher.
XAGUSD 4-Hour Chart – Positive Price Development
The 4-hour chart for Spot Silver also shows strong bullish momentum above the $35 support area. The correction toward $35.50 has led to renewed buying, with the price now hovering around the $37.10 level. This bullish momentum is likely to continue, with strong resistance expected around the $38 and $40 levels.
US Dollar Index Technical Analysis
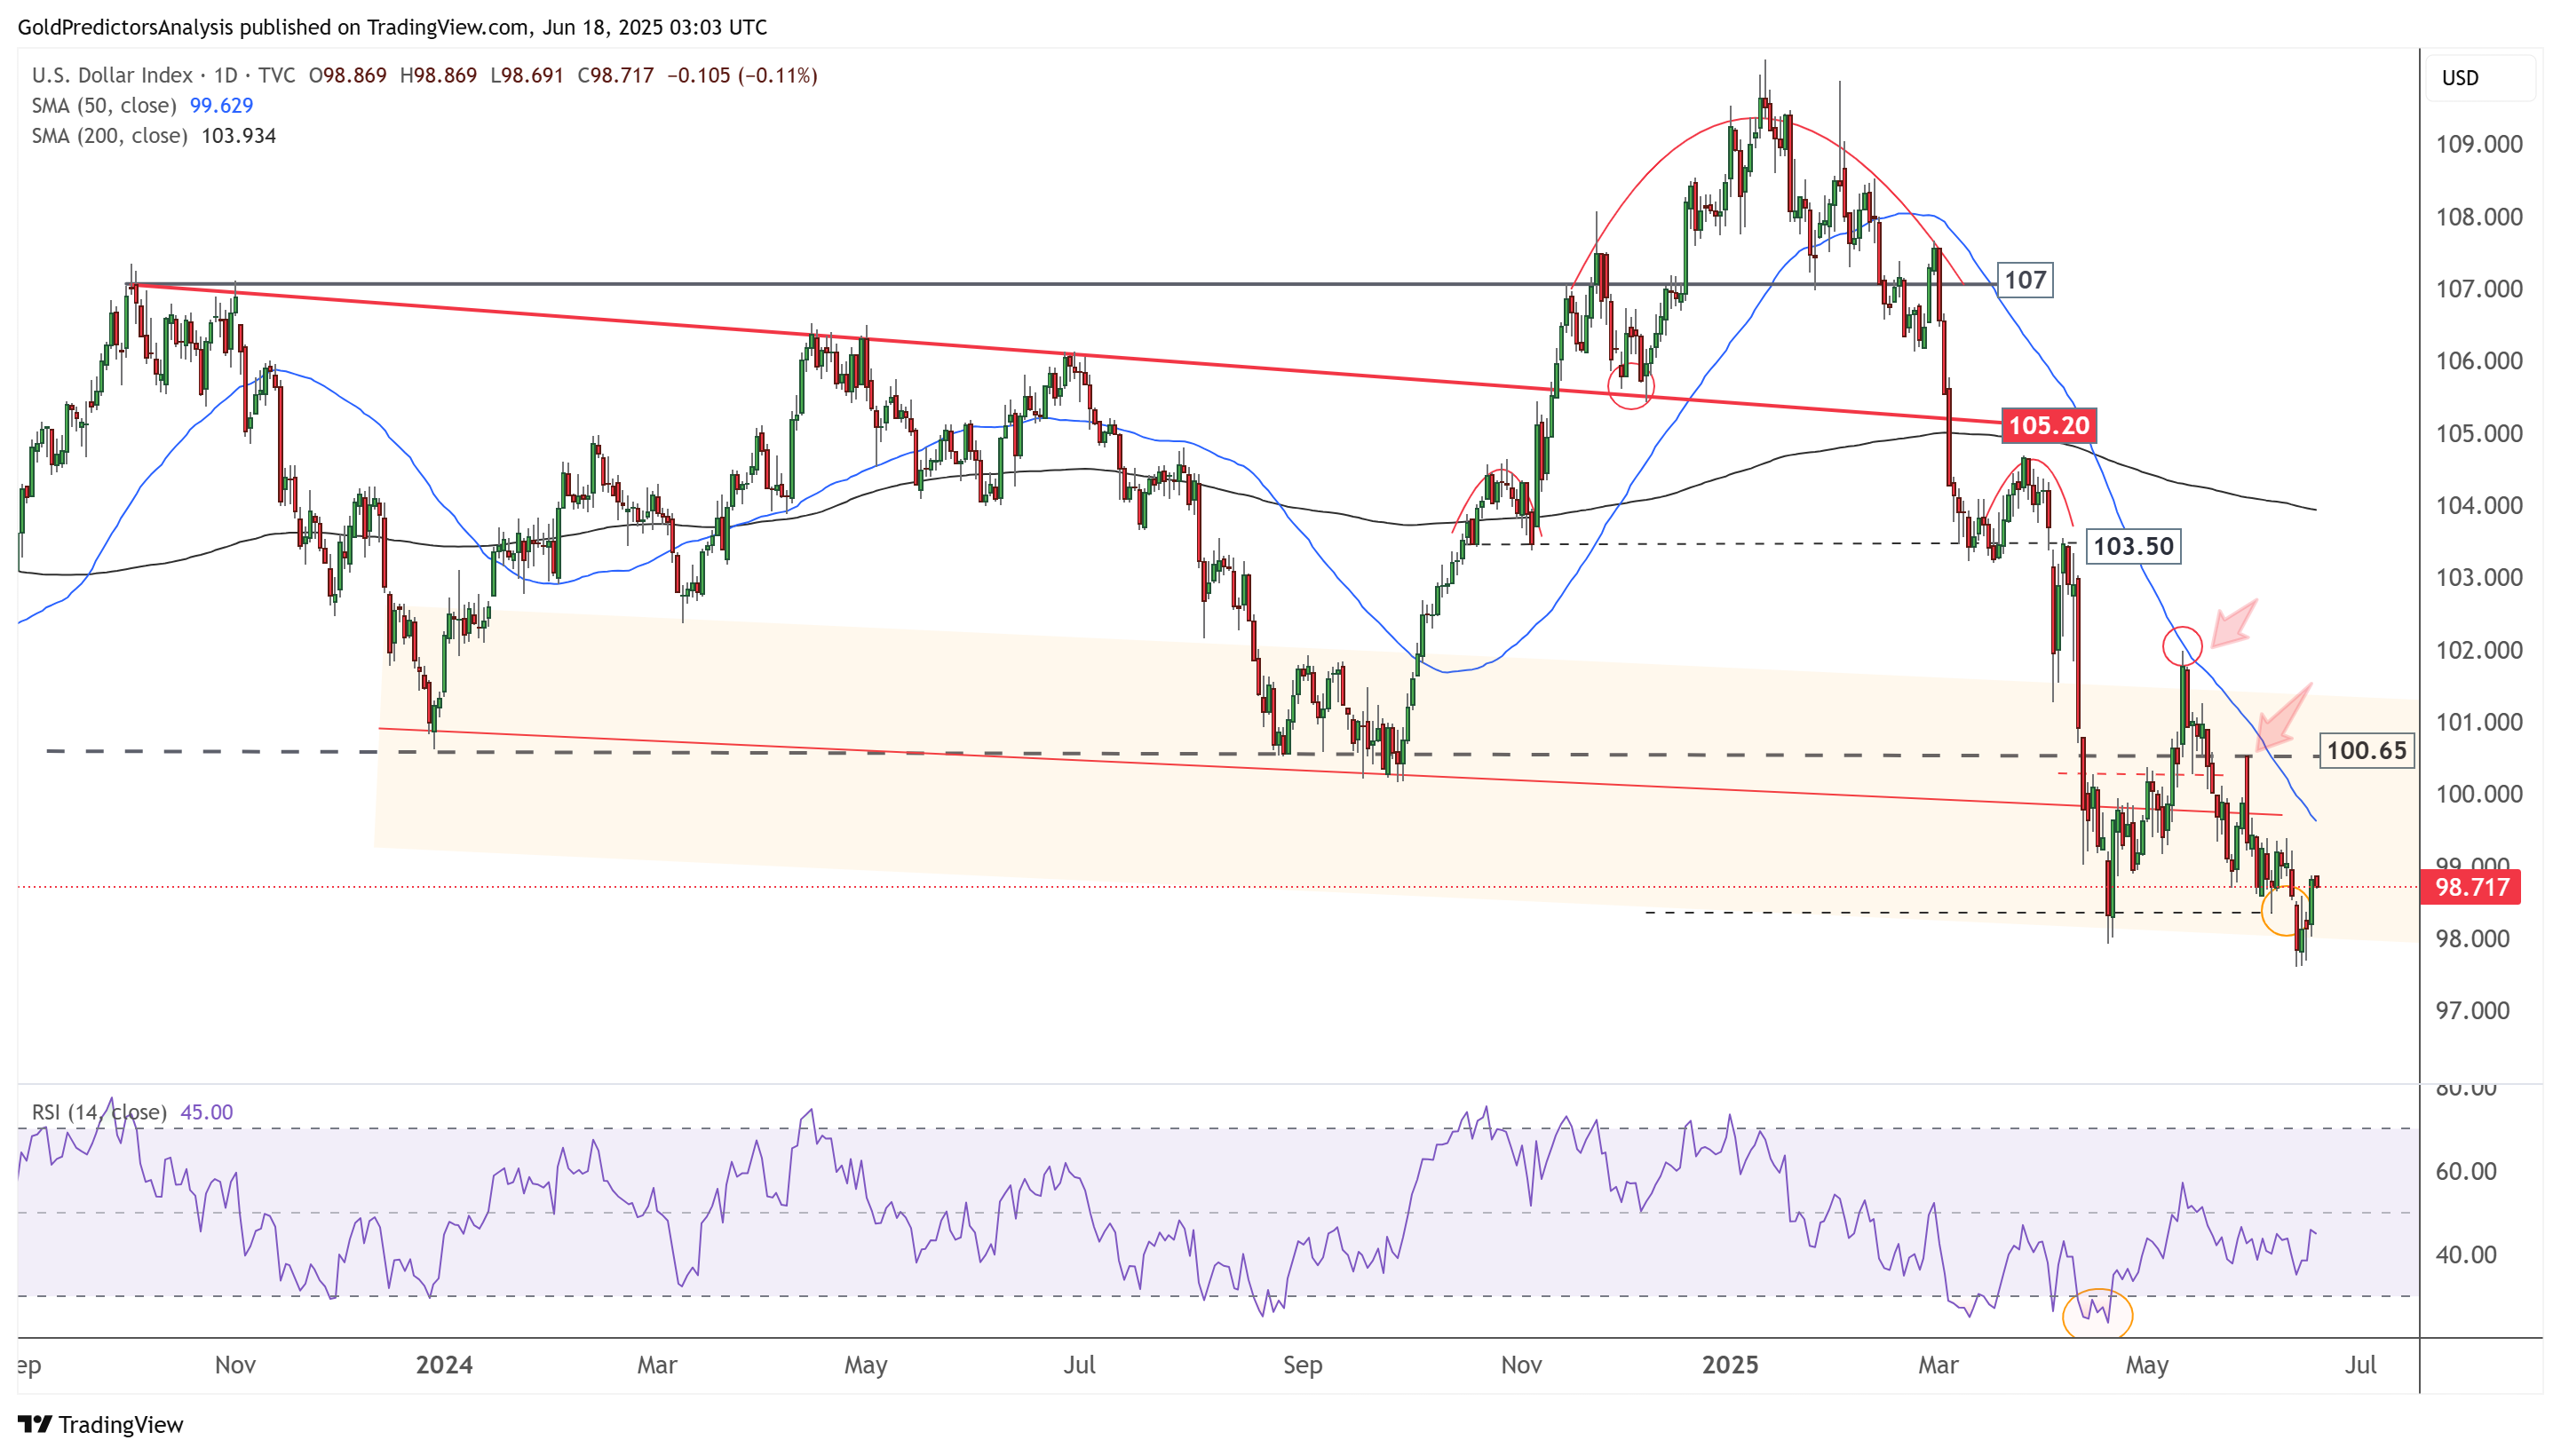
US Dollar Daily – Uncertainity Ahead of Fed Decision
The daily chart for the US Dollar Index shows that it has rebounded from the 98 areas but remains under bearish pressure. This rebound is occurring near the strong long-term support level around 98. Despite the bounce, the overall price action remains negative. As long as the index stays below 100.65, further downside is likely.
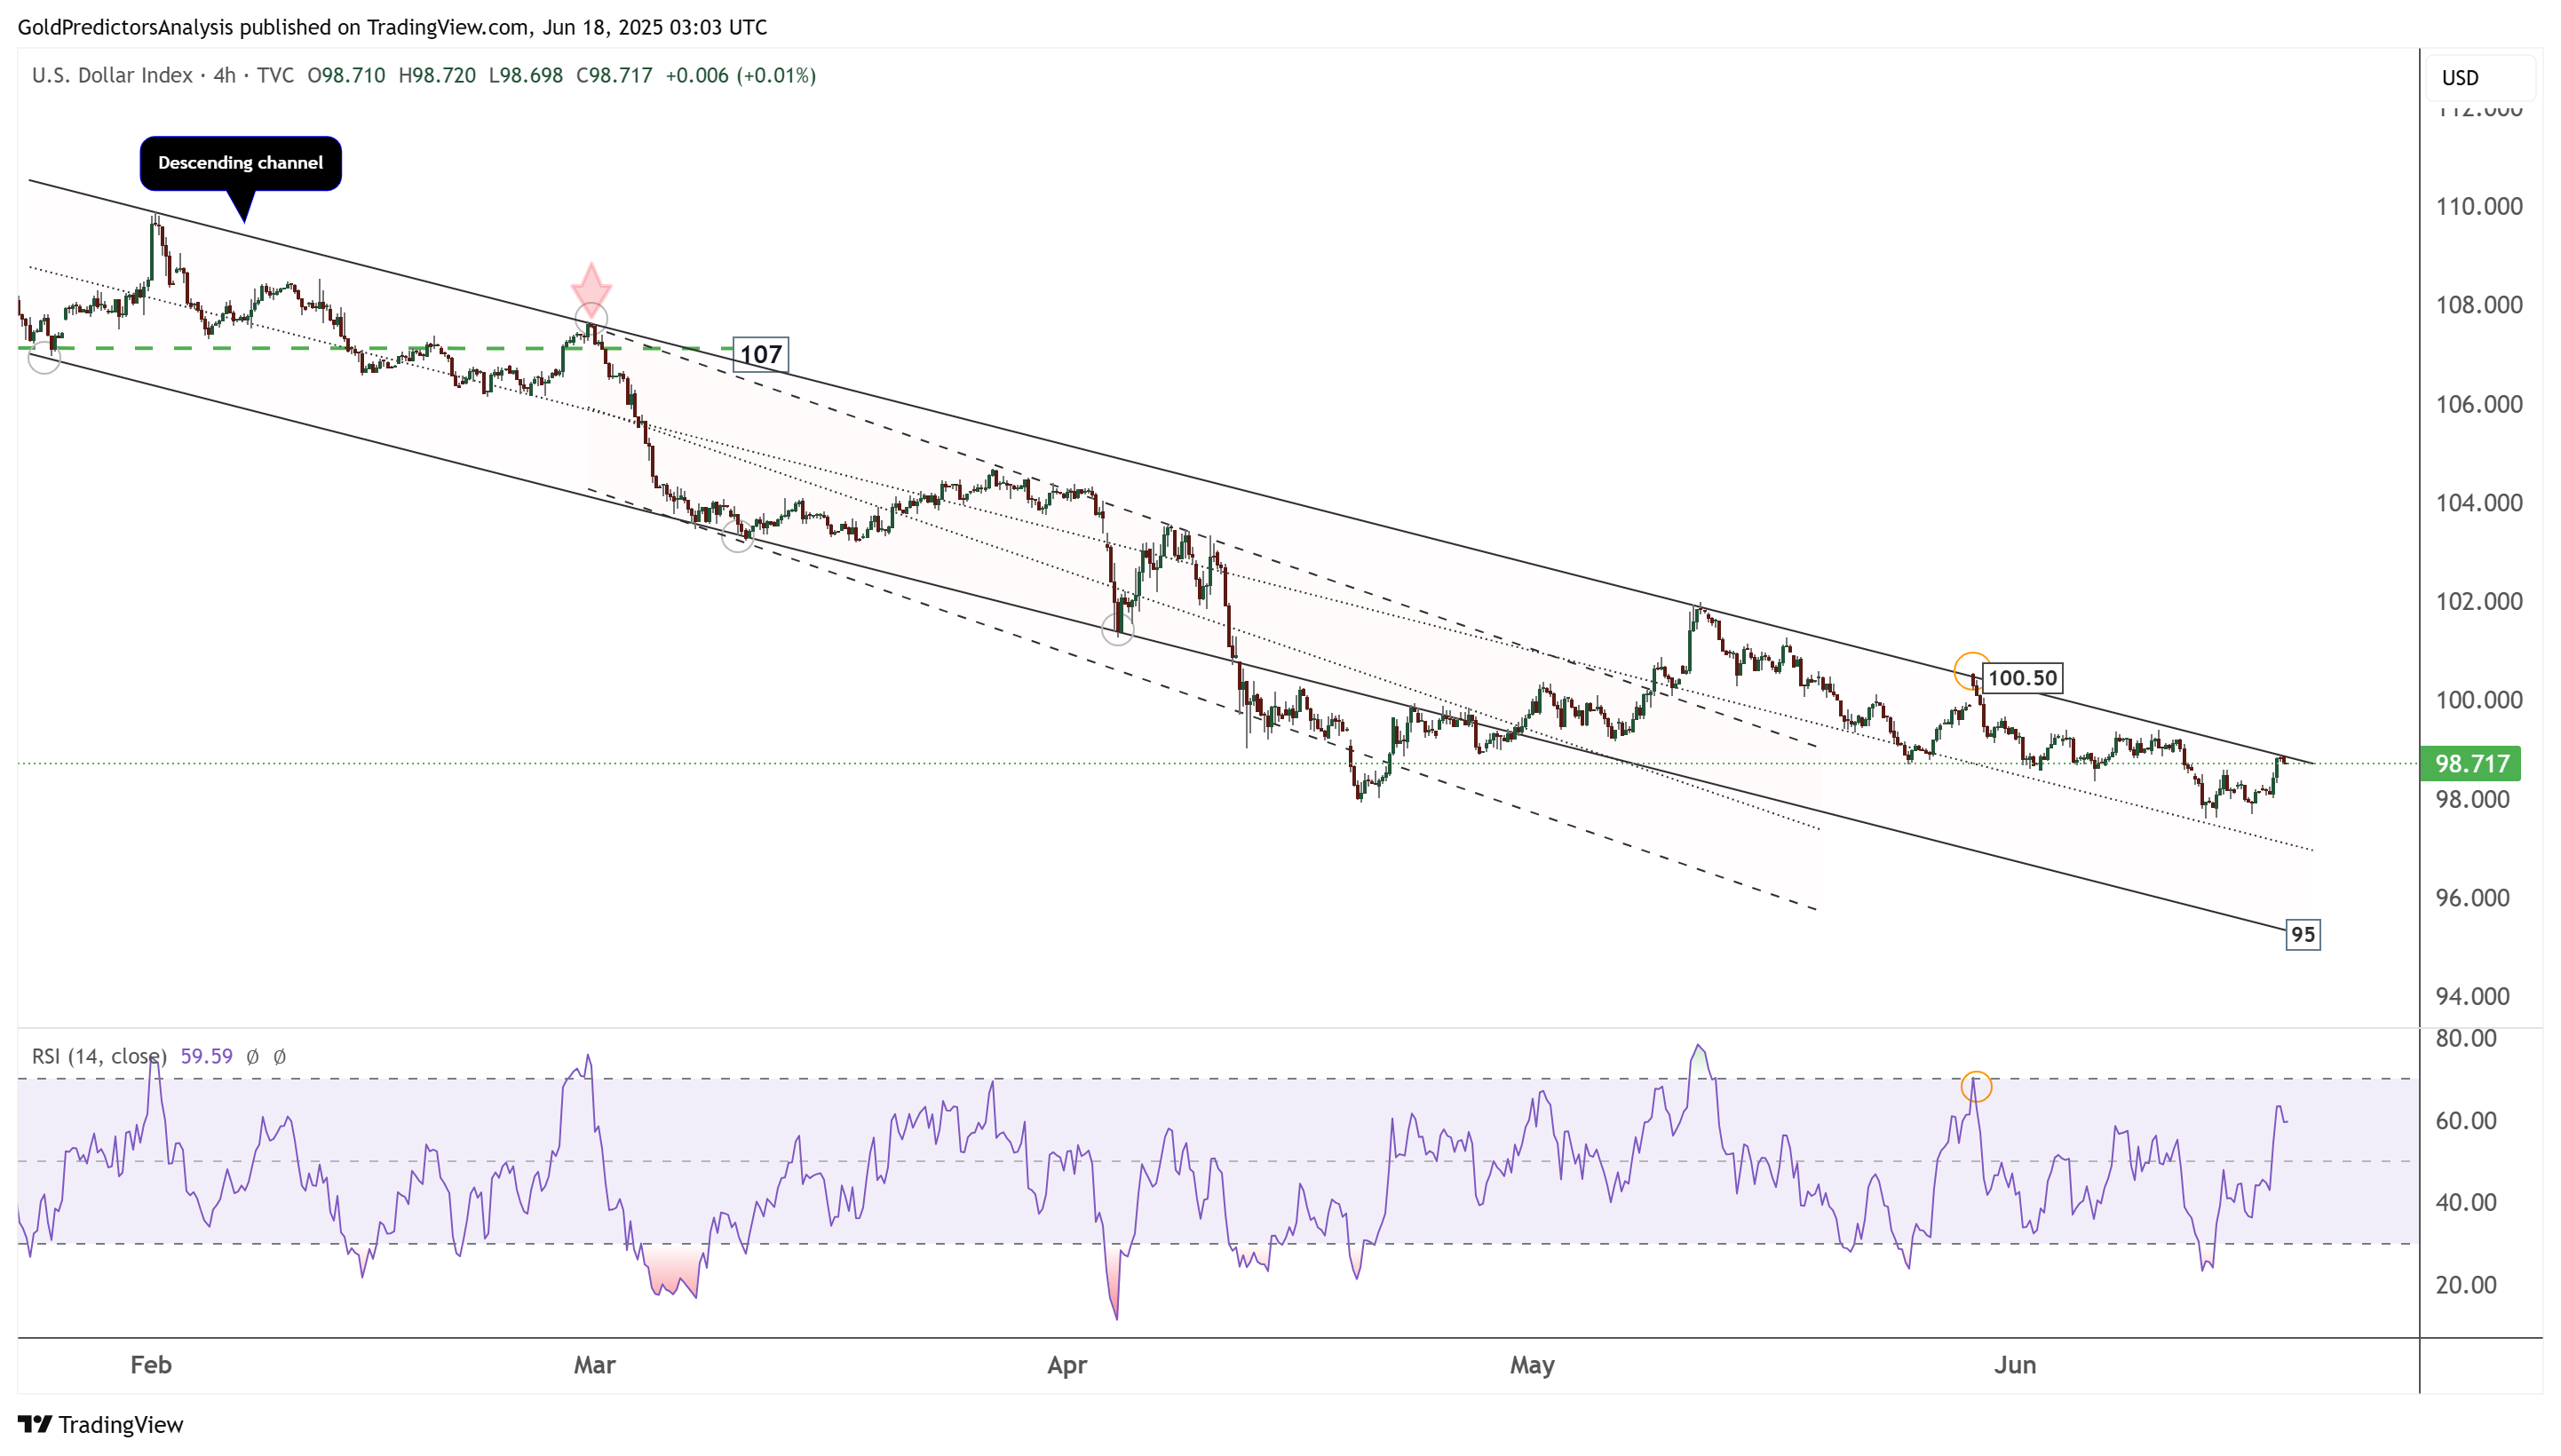
US Dollar 4-Hour Chart – Descending Channel
The 4-hour chart for the US Dollar Index shows that the index is trading near the resistance of the descending channel. As long as it remains below the 100.50 level, the downtrend is likely to continue toward the 95 region. This area serves as key support within the channel. A break below 95 could trigger a strong decline toward the 90 level.
About the Author
Bob MasonChief Crypto Boss
123456789 30 He has written extensively for a broader audience and his current focus is on developments relating to the financial markets including, but not limited to currencies, commodities, alternative asset classes, and global equities.


Advertisement