
Advertisement
Advertisement
BTC Price Outlook: $100K Support Holds Despite ETF Outflows, Trade Tensions
By:
Key Points:
- Bitcoin steadies near $104K after ETF inflows falter. Key drivers now include Fed policy, the Bitcoin Act, and global trade risks.
- BTC-spot ETFs post first weekly outflow in six weeks as US-China trade war and tariff hikes shake investor confidence.
- BlackRock's IBIT dominates ETF inflows amid rising outflows, highlighting institutional interest despite BTC market headwinds.

BTC-Spot ETF Ends Six-Week Inflow Streak
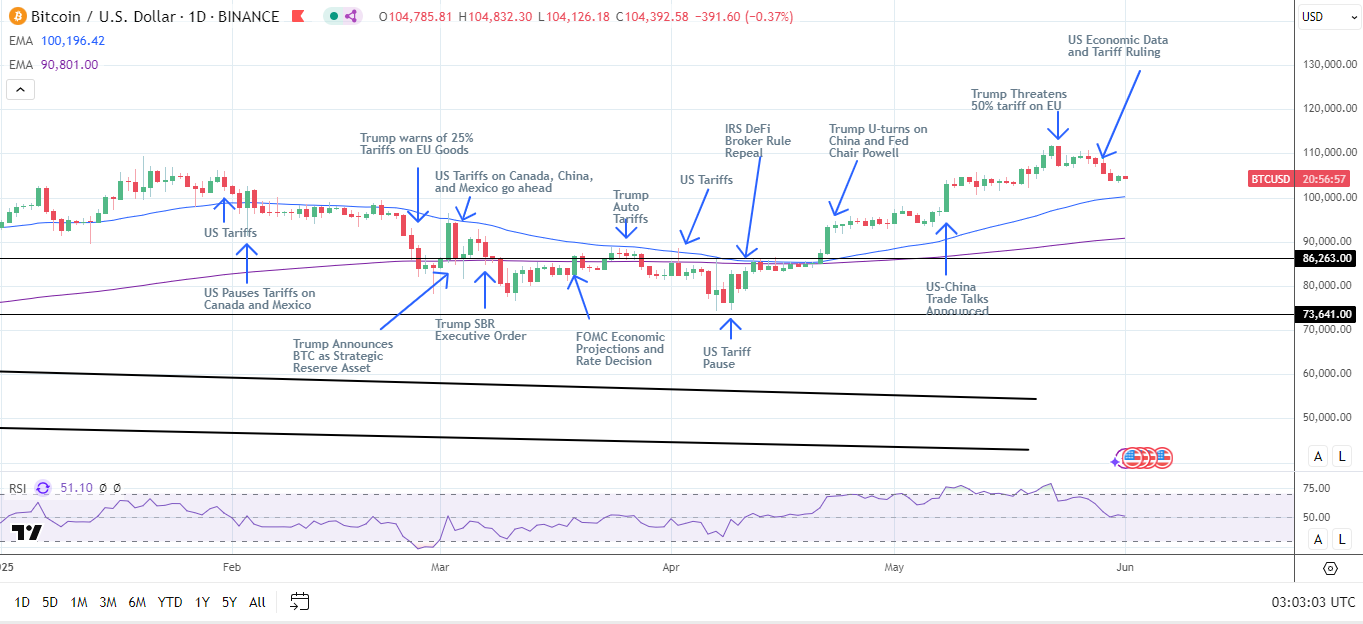
Bitcoin (BTC) advanced 0.69% on Saturday, May 31, partially reversing Friday’s 1.51% loss to close at $104,784. Notably, BTC fell to a session low of $103,200, its lowest level since May 19, while holding above $100,000 since May 8.
An escalation in the US-China trade war and Trump’s tariff hike on steel imports weighed on demand for BTC-spot ETFs.
According to Farside investors, BTC-spot ETF issuers recorded total net outflows of $144.8 million in the week ending May 30.
Despite net outflows of $430.8 million on May 30, BlackRock’s (BLK) iShares Bitcoin Trust (IBIT) still recorded weekly net inflows of $584.6 million, underscoring its dominant market position. Friday’s IBIT outflows were the first since April 9, reflecting the impact of trade developments on buyer appetite.
Bloomberg Intelligence Senior ETF Analyst Eric Balchunas remarked on IBIT’s dominance, stating:
“The IBIT vs Everyone Else flow disparity is interesting. Normally IBIT takes in 70% of the net inflows but lately it’s over 100%. My theory: the latest rally was more an institutional buying spree than retail (perhaps sparked by the decoupling and lessened vol).”
Balchunas estimated that institutional investors accounted for 10%, advisors 20%, and retail investors made up the remainder.
BTC-spot ETF market flows remain crucial for BTC’s supply-demand balance and price trajectory. In May 2025, issuers registered total net inflows of $5,232.1 million, supporting BTC’s climb to a May 22 record high of $111,917.
BTC Price Outlook: Key Drivers
BTC’s near-term price trend depends on several key macro and market drivers:
- US-China trade developments will influence risk appetite and broader crypto market trends.
- Legislative developments, including the Bitcoin Act’s progress on Capitol Hill.
- US economic data could fuel Fed rate cut bets and recession risk.
- US BTC-spot ETF flows remain crucial to near-term price trends.
BTC Price Scenarios:
- Bullish Scenario: Easing trade tensions, dovish Fed bets, Bitcoin Act support, and strong ETF inflows may drive BTC toward $111,917.
- Bearish Scenario: Renewed trade tensions, hawkish Fed cues, legislative gridlock, or ETF outflows could drag BTC below $100,000.
For ongoing insights into macro trends, regulation, and ETF data, follow our analysis here.
Technical Analysis
Bitcoin Analysis
BTC trades above the 50-day and the 200-day Exponential Moving Averages (EMA), reaffirming bullish momentum.
- Upside Target: A breakout above $105,000 could pave the way to the record high of $111,917. A sustained move through $111,917 may bring $115,000 into play.
- Downside Risk: A drop below the 50-day EMA and $100,000 could expose BTC to $95,000 and potentially the 200-day EMA.
The 14-day Relative Strength Index (RSI) at 51.1 suggests BTC has room to climb to $111,917 before entering overbought territory (RSI > 70).
Stay ahead of market trends by accessing real-time BTC price data and technical indicators here.
Ethereum Analysis
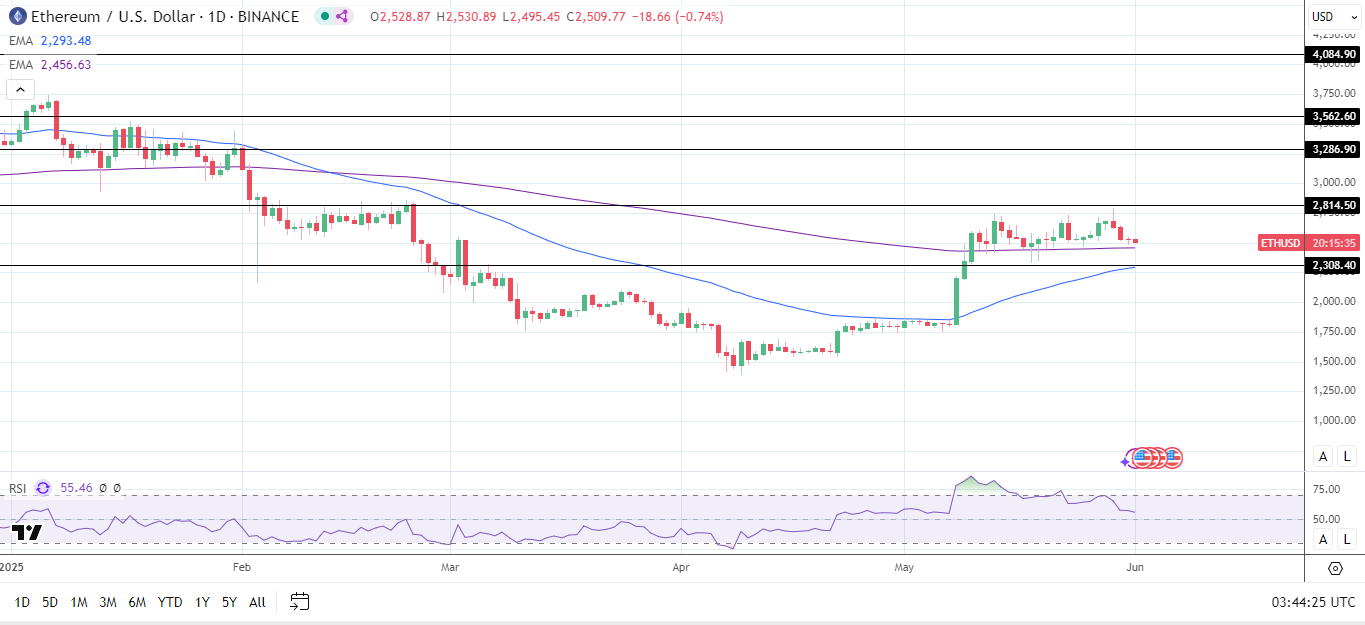
Turning to ethereum (ETH), ETH continued trading above the 50-day and 200-day EMAs, despite three successive losses, affirming bullish momentum.
- Upside target: A breakout above the May 29 high of $2,791 could support a move toward the $2,815 resistance level. A sustained move through $2,815 could bring $3,000 into sight.
- Downside risks: If ETH breaks below the 200-day EMA, the $2,308 support level and the 50-day EMA would be the next key support levels. Buying pressure could intensify at the $2,308 support level since the 50-day EMA is confluent with it.
The 14-day Relative Strength Index (RSI) at 55.46 suggests ETH could climb to $3,000 before entering overbought territory (RSI > 70).
Stay informed on BTC and ETH trends by tracking macroeconomic developments, ETF flows, and technical indicators here.
About the Author
Bob MasonChief Crypto Boss
123456789 30 He has written extensively for a broader audience and his current focus is on developments relating to the financial markets including, but not limited to currencies, commodities, alternative asset classes, and global equities.


Advertisement