
Advertisement
Advertisement
Ethereum Price Prediction: ETH Cup and Handle Breakout Could Push it to $4,000
By:
Key Points:
- Ethereum’s daily transaction volumes hit a yearly record in late May.
- ETH could rise above $4,000 if a bullish cup and handle pattern is confirmed.
- The 200-day EMA is the key support to watch.

In previous price predictions, we set a price target of $3,000 for ETH based on a historical pattern. The price got quite near that target already as it traded near $2,800 recently.
However, the token has been consolidating lately as momentum indicators hit extreme levels while the latest tensions between the U.S. and China have spooked investors once again.
Despite this temporary pause, a new technical pattern has emerged that could result in strong gains for ETH and a potential push above the $4,000 level.
Ethereum’s Daily Transaction Volumes Hit Record
The Ethereum decentralized finance (DeFi) ecosystem has been recording increasingly higher trading volumes since the year started as per data from DeFi Llama.
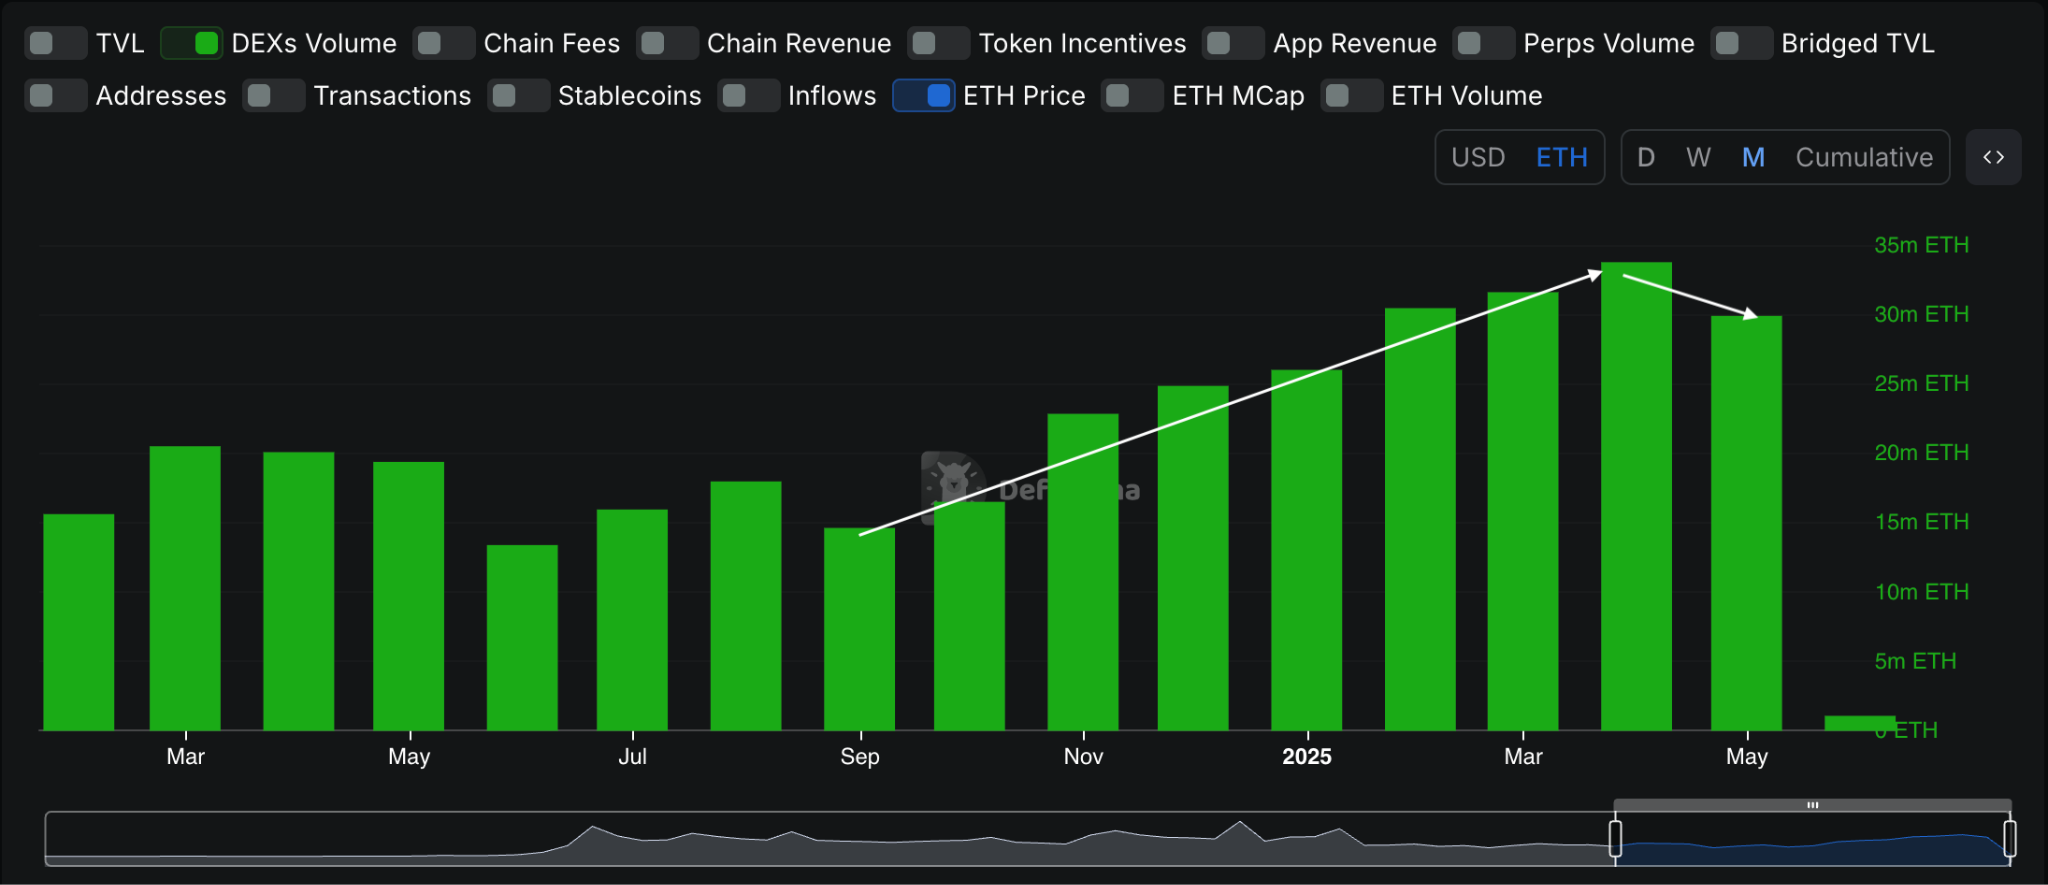
DEX volumes, expressed in ETH, grew from 26 to 34 million ETH tokens from January to April but experienced a decline last month for the first time in a year as they ended at 30 million ETH.
This may be one of the reasons why ETH has stalled lately as demand for the token across DEXs may have cooled off after the strong rally that cryptos experienced during that period.
Investors may have favored Bitcoin (BTC) over ETH as the former struggled to rise above the $3,000 mark – a critical psychological threshold that the market may have expected to surpass during this recent rally.
Meanwhile, daily transaction volumes surged to 1.5 million for the first time since January 13 in the last two days of May.
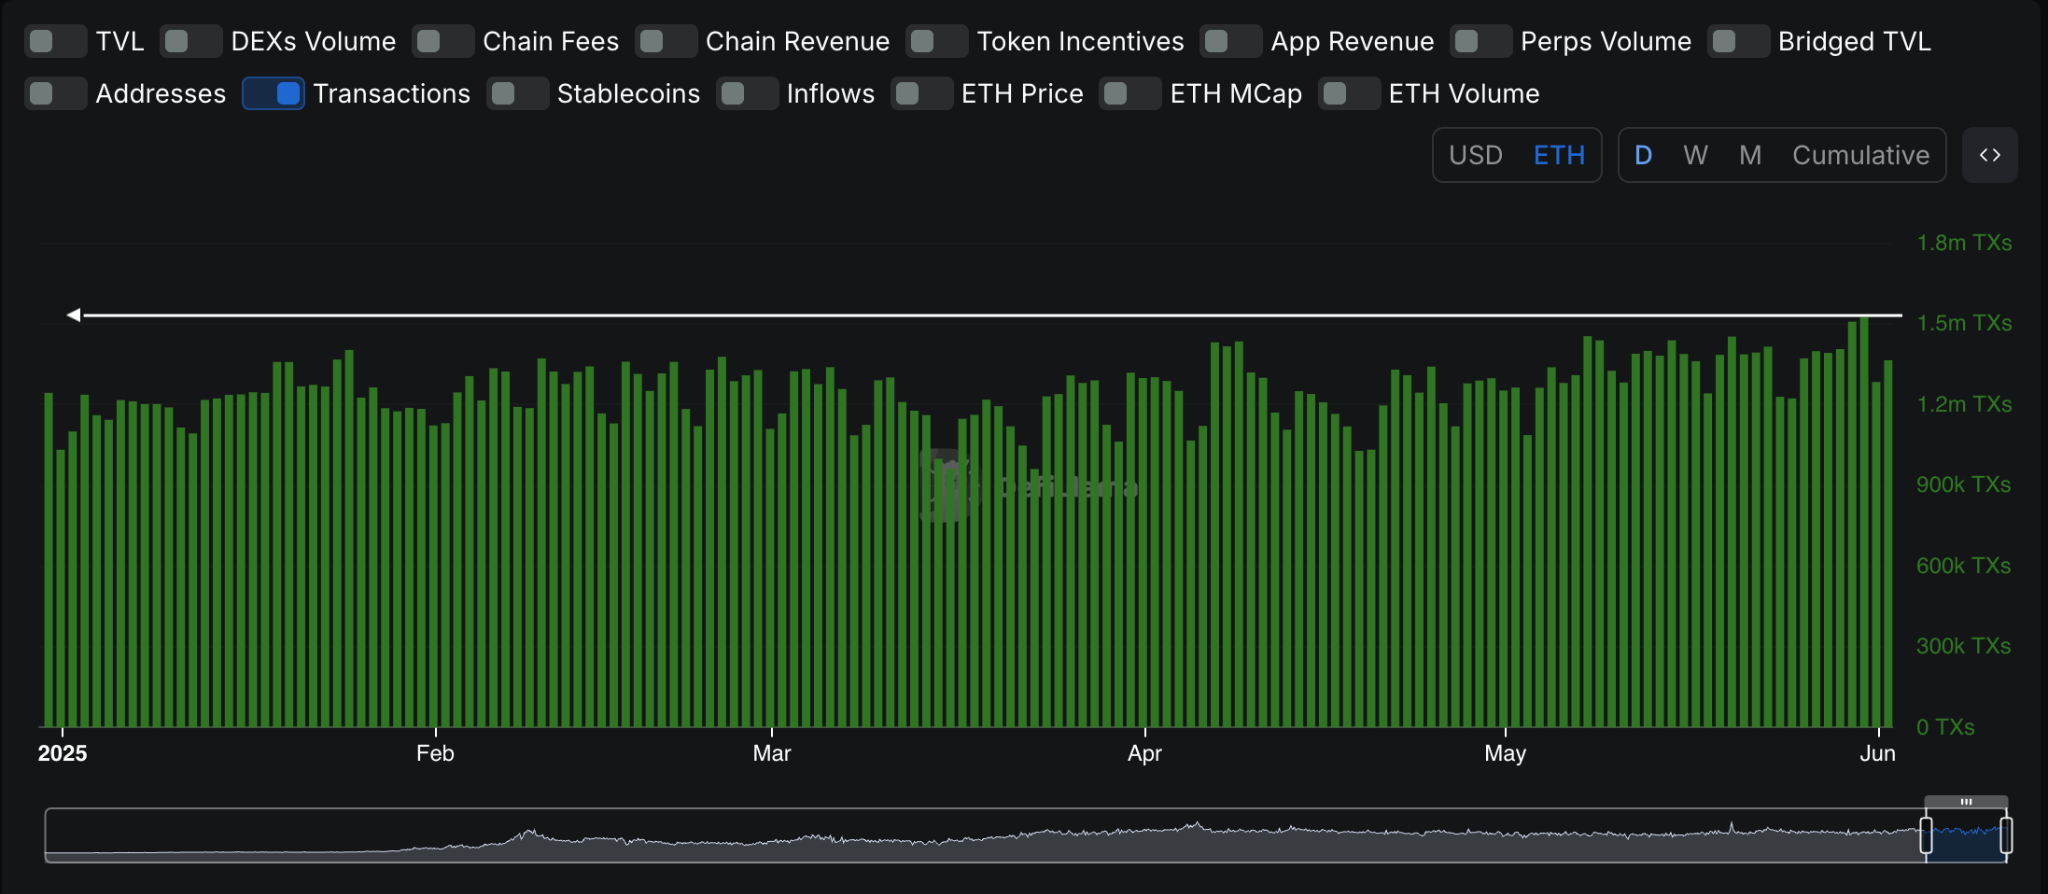
Transaction volumes have also been increasing since late April, possibly as the Pectra upgrade has successfully reduced transaction costs for layer-2 solutions like Arbitrum.
These protocols are now able to incorporate a higher number of blobs – datasets – per ETH block, which increases their efficiency and lowers their operational costs.
ETH Forms Bullish Cup and Handle
The daily chart shows that a bullish pattern known as a cup-and-handle has formed as a result of the token’s price action since February.
This pattern consists of a neckline that the price retests multiple times after a strong recovery from a recent downtrend. These retests weaken the selling pressure at those levels and ultimately push the price higher after a bullish breakout.
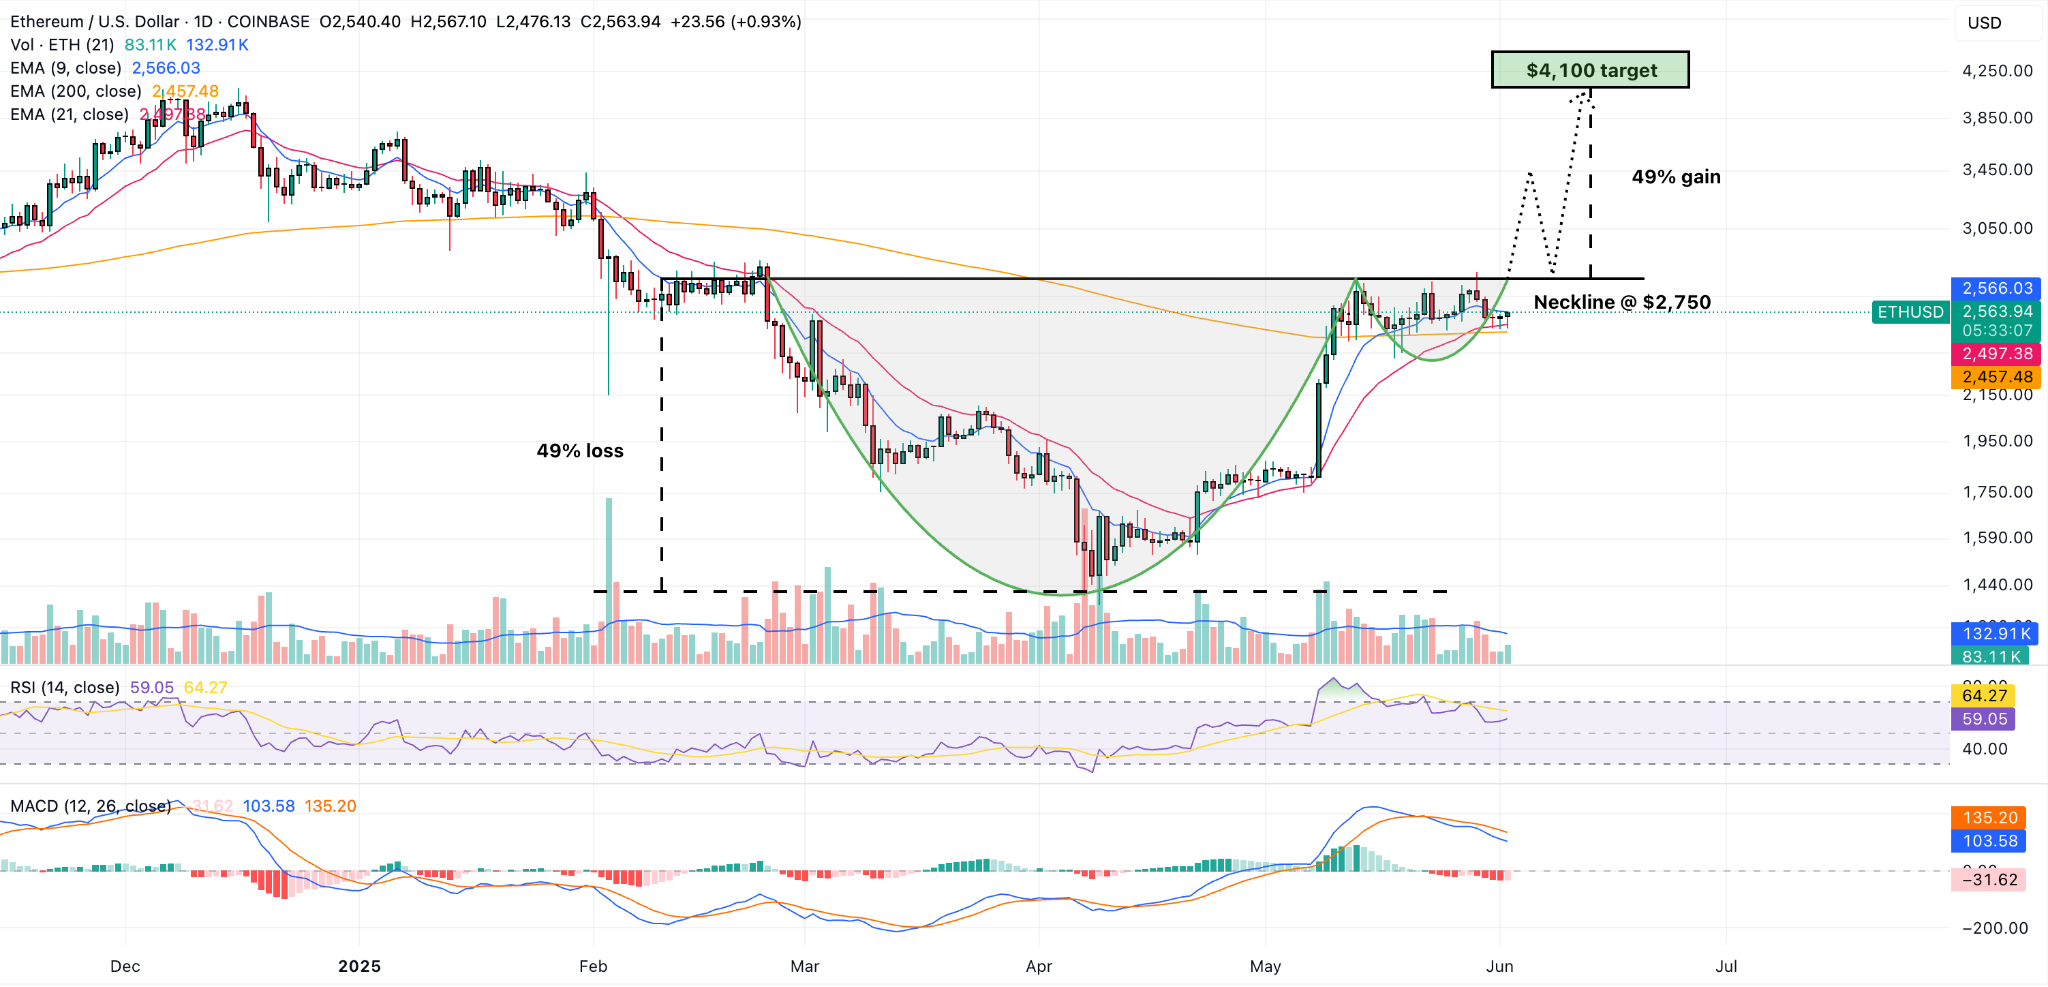
The 200-day exponential moving average (EMA) seems to have been acting as a key support for the pattern’s handle. Hence, this would be a key level to watch as a break below may invalidate it.
If ETH breaks above $2,750, we could expect a strong push to $3,000 and a subsequent drop to retest this former resistance level from above.
If that happens and the price stays above $2,750, the pattern would be confirmed and this could result in gains of 49%. Typically, technical analysts use the handle’s size as a reference to predict how high the price could go after a bullish breakout.
In this case, this 49% gain could push Ethereum to $4,100, making this our mid-term target for the token if the pattern is confirmed.
What are the odds that this cup-and-handle pattern resolves to the upside? Momentum indicators have been dropping lately. However, the price action seems to be in a phase of consolidation. This could be interpreted as a period of accumulation.
Hence, as long as the price stays above its long-term EMA, ETH’s outlook will continue to be bullish.
About the Author
Bob MasonChief Crypto Boss
123456789 30 He has written extensively for a broader audience and his current focus is on developments relating to the financial markets including, but not limited to currencies, commodities, alternative asset classes, and global equities.


Advertisement