
Advertisement
Advertisement
US Dollar Price Forecast: Falls as Inflation Cools, Fed Rate Cut Bets Rise – GBP/USD and EUR/USD
By:
Key Points:
- US Dollar Index slips below 98.60 as May CPI misses forecasts, raising Fed rate cut bets for September.
- Trump’s tariff-laden China deal claim triggers market volatility, adding pressure on the dollar.
- EUR/USD hits 1.1522 after breaking resistance at 1.1495, driven by soft inflation and strong bullish momentum.

Market Overview
During Thursday’s Asian session, the US Dollar Index (DXY) extended its slide for a second day, hovering near 98.25. The decline follows softer-than-expected inflation data, reinforcing speculation that the Federal Reserve could begin easing rates by September.
CPI Miss Sparks Dovish Fed Expectations
May’s Consumer Price Index (CPI) rose 2.4% year-on-year, underwhelming forecasts of 2.5%. Core CPI eased to 2.8%, below the expected 2.9%.
These figures strengthened market bets on a 25-basis-point Fed rate cut, with the CME FedWatch Tool showing rising odds for September. Weakening inflation and broader signs of slowing growth weighed on the dollar.
Trump’s China Comments Add Uncertainty
Former President Donald Trump’s claim that a US-China trade deal is nearly finalized, featuring a 55% tariff on Chinese goods, sparked further volatility. The market remains cautious, with no official confirmation from Beijing.
Despite escalating tensions with Iran and US evacuation advisories, the dollar hasn’t gained safe-haven traction, as dovish Fed bets continue to dominate sentiment.
US Dollar Index (DXY) – Technical Analysis
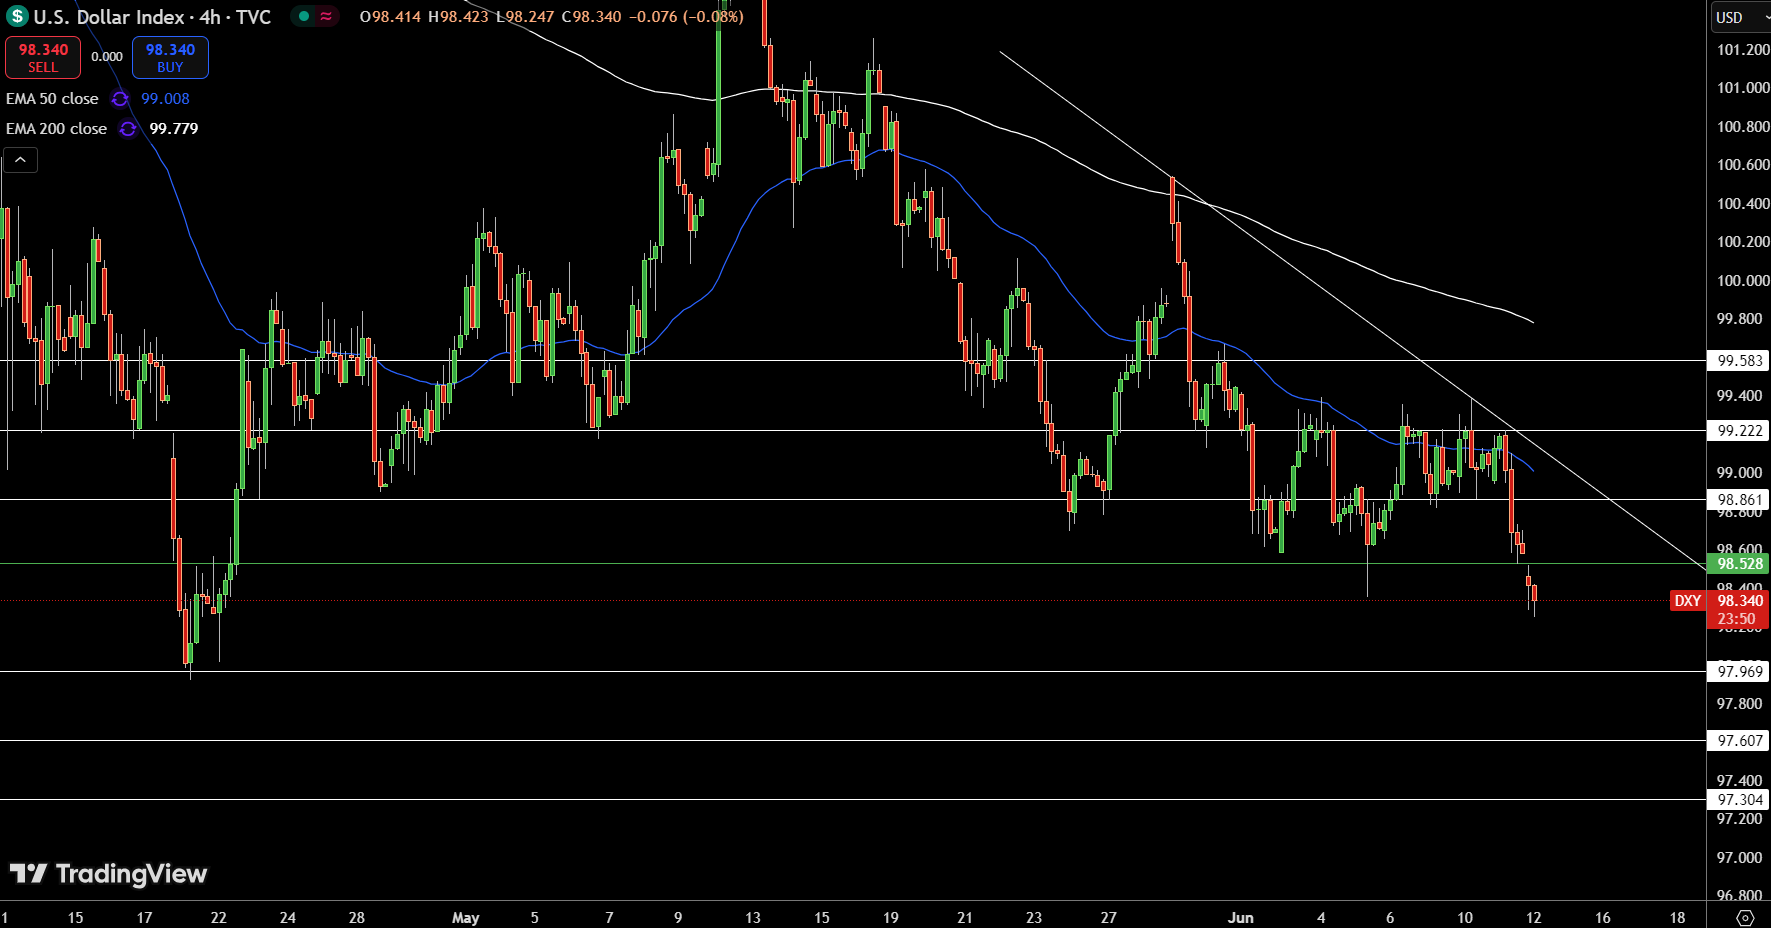
The U.S. Dollar Index (DXY) has broken decisively below the key 98.60 support zone, currently trading near 98.34 and extending its bearish trend. This marks a clean breakdown from its recent consolidation range, which had held since late May.
Both the 50 EMA (99.00) and 200 EMA (99.77) remain well above the current price, confirming downside momentum and reinforcing the bearish outlook.
The rejection at the descending trendline and failure to reclaim the 99.22 resistance zone further cemented near-term weakness.
If the sell-off continues, the next levels to watch are 98.00, followed by 97.60. A sustained drop below 97.60 could expose 97.30 and possibly 96.80. Only a break back above 98.86 would neutralize immediate downside pressure.
GBP/USD Technical Analysis
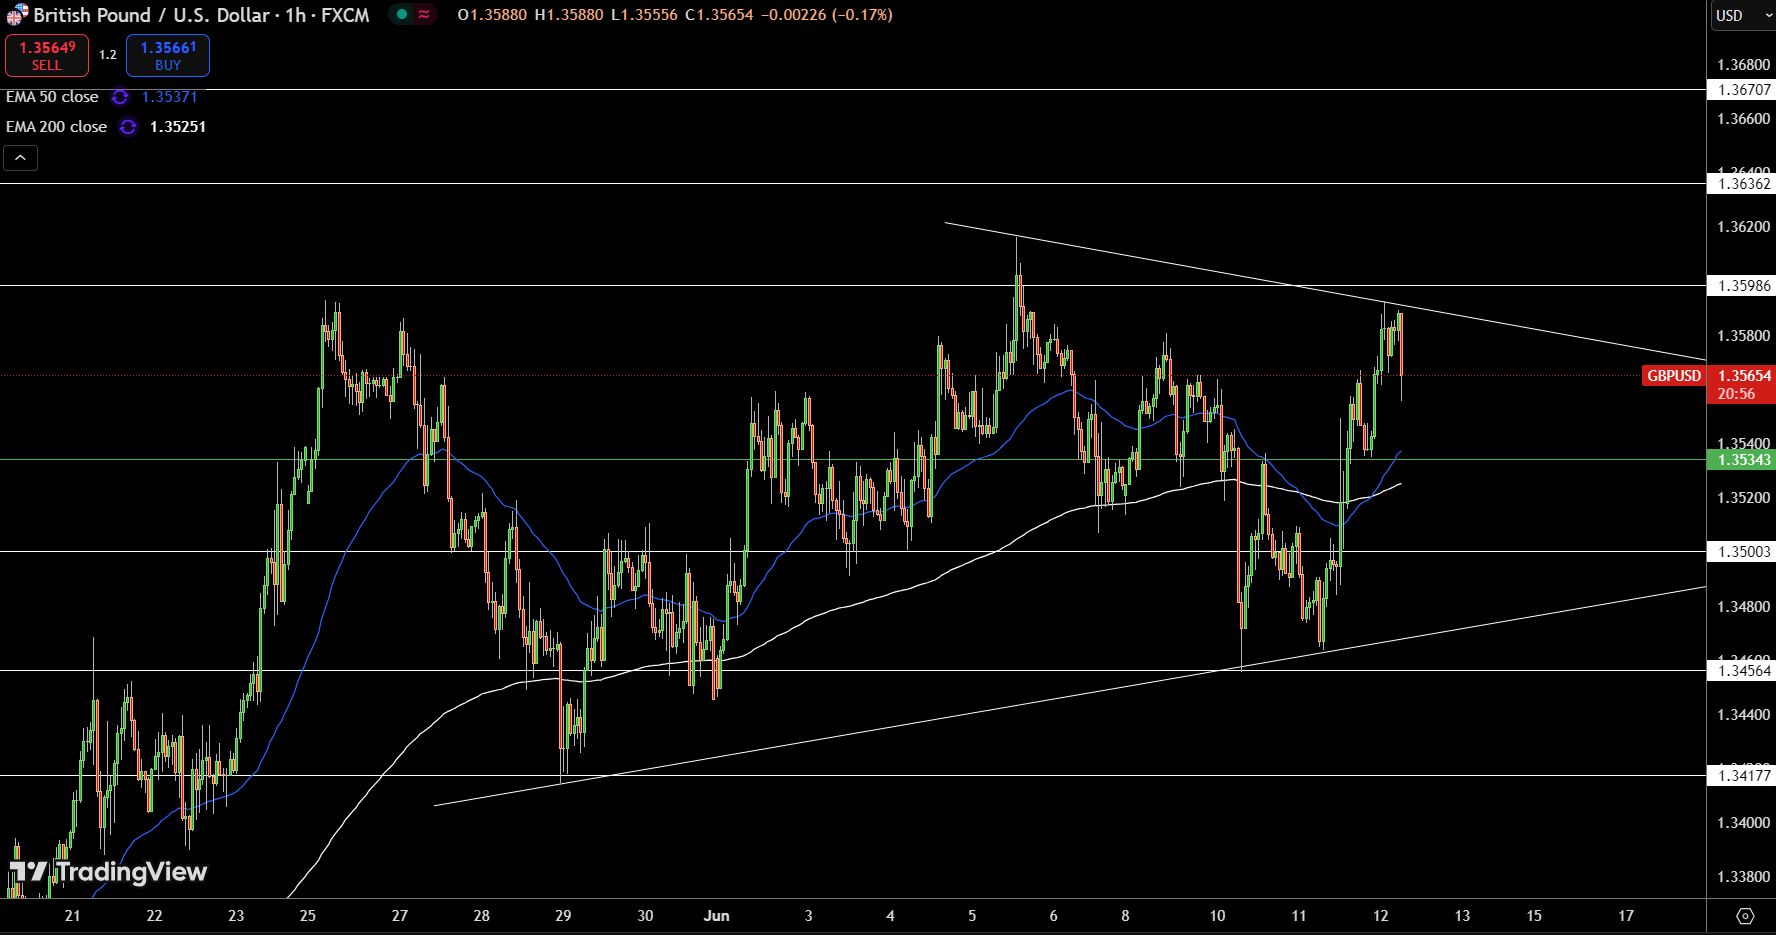
GBP/USD is testing resistance near 1.3588 after a sharp recovery from the 1.3480 region. The pair is trading between converging trendlines, forming a symmetrical triangle, while holding above both the 50 EMA (1.3537) and 200 EMA (1.3525) on the hourly chart.
The immediate hurdle lies at 1.3598; multiple rejections here reinforce it as a strong barrier. A confirmed breakout above this level could target 1.3626 and then 1.3670. On the downside, key support is seen at 1.3534, with a break below exposing 1.3500 and 1.3456.
As long as the price remains above the 200 EMA, the bias remains mildly bullish; however, a breakout is needed to confirm the direction.
EUR/USD Technical Forecast
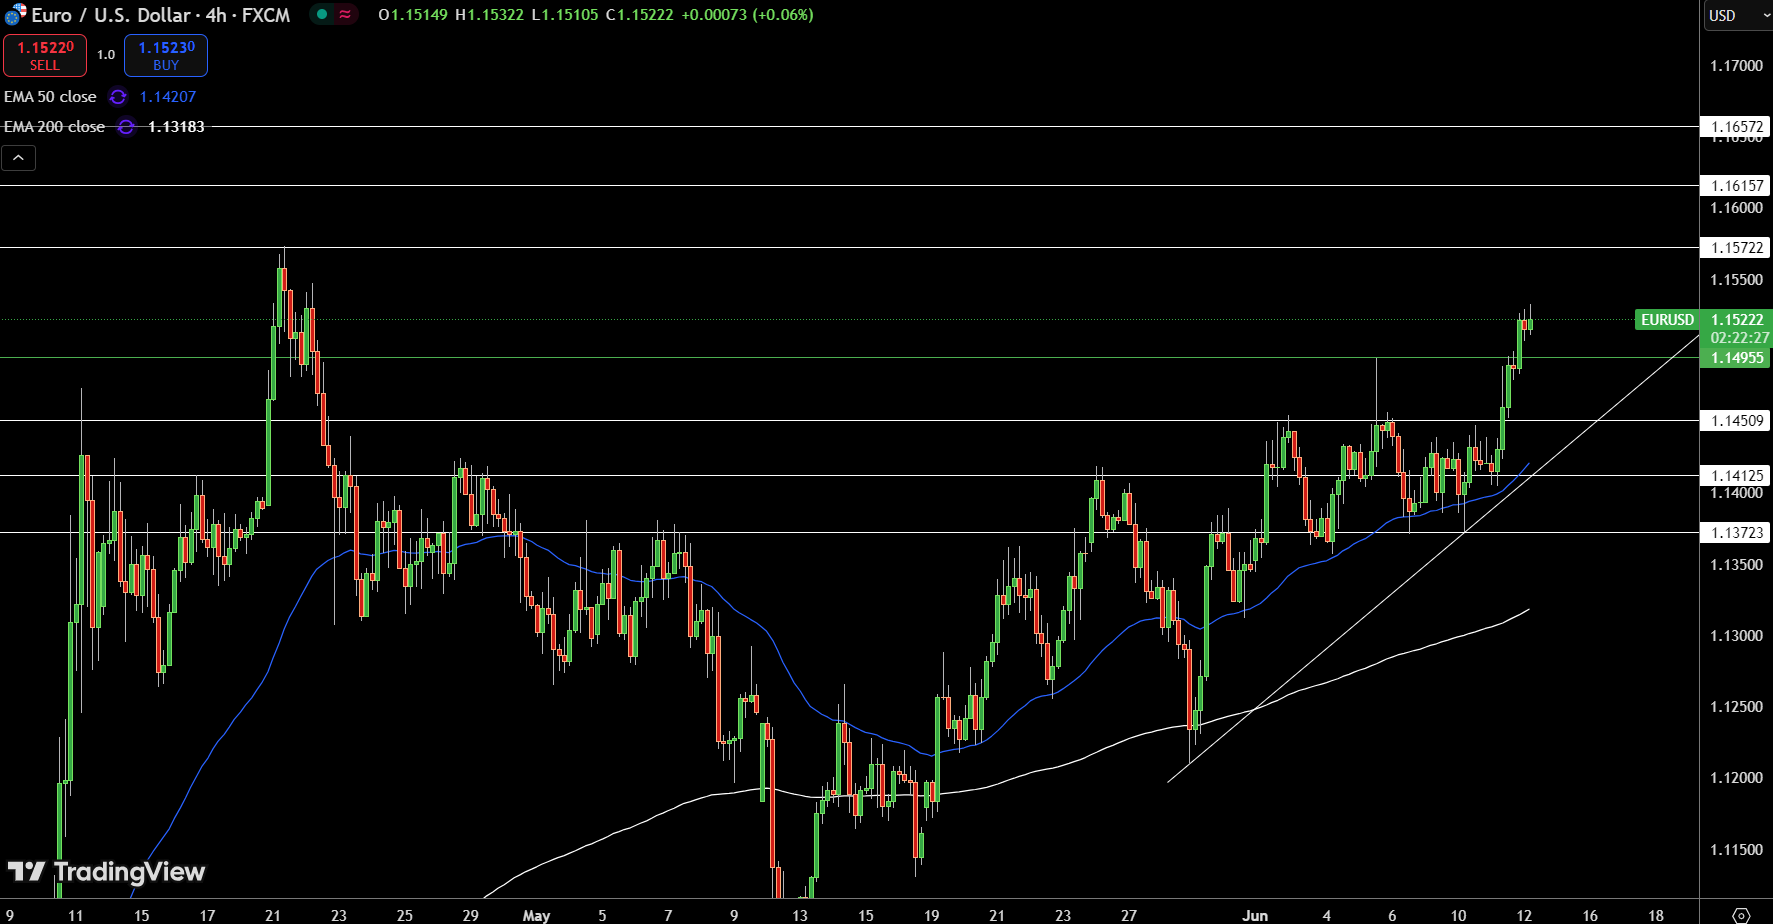
EUR/USD has broken out to fresh multi-month highs, currently trading near 1.1522 after surging past the key 1.1495 resistance level. A steep ascending trendline firmly supports the pair, which is trading well above both the 50 EMA (1.1420) and the 200 EMA (1.1318), confirming strong bullish momentum.
The breakout is backed by weakening U.S. Dollar sentiment following soft inflation data and rising rate cut expectations. If bulls maintain control, the next upside targets are 1.1572 and 1.1615.
Immediate support rests at 1.1495, followed by the trendline near 1.1450. The structure remains bullish as long as the price holds above the 1.1450–1.1495 support zone.
About the Author
Bob MasonChief Crypto Boss
123456789 30 He has written extensively for a broader audience and his current focus is on developments relating to the financial markets including, but not limited to currencies, commodities, alternative asset classes, and global equities.


Advertisement