
Advertisement
Advertisement
Trump Trade War, China Slowdown, and Middle East Crisis Fuel Oil Volatility
By:
Key Points:
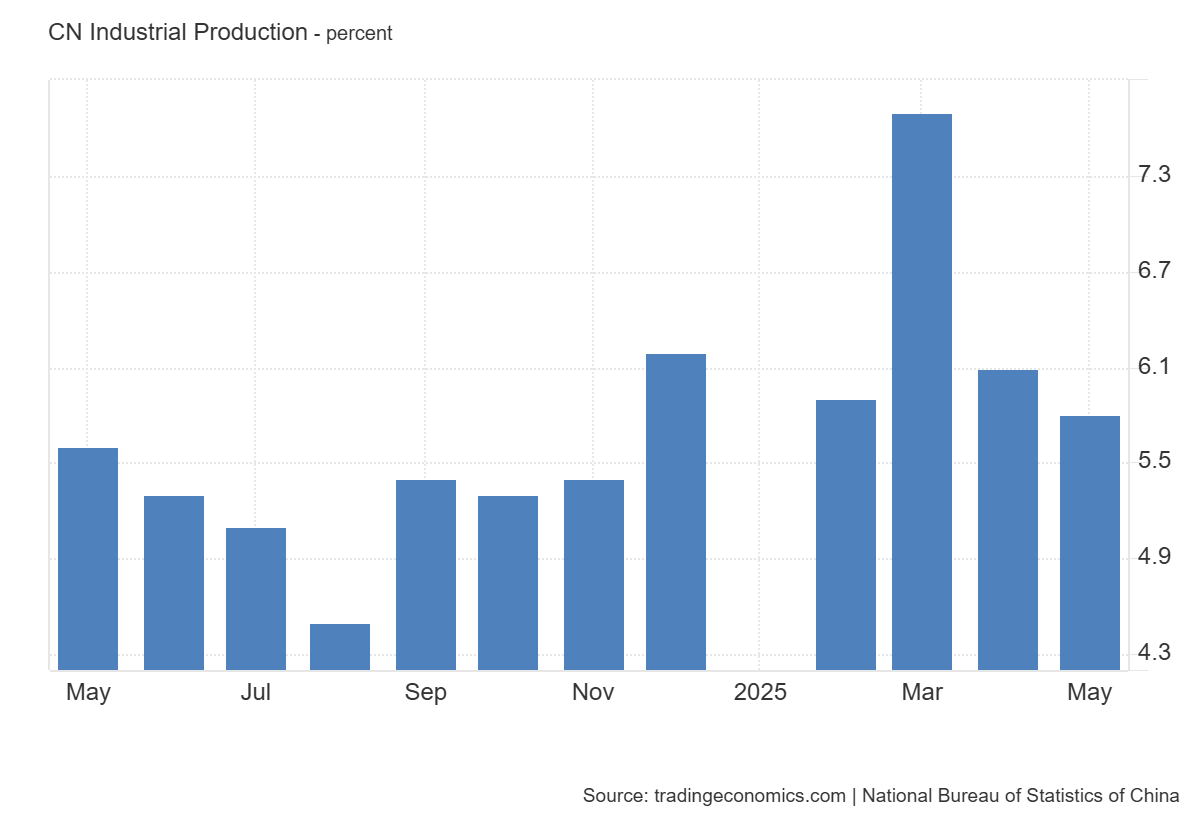
- China’s industrial output slowed to 5.8% in May, reflecting manufacturing strain.
- Iran’s missile strikes on Israel sparked fears of a broader regional conflict, fueling market volatility.
- WTI crude oil (CL) rebounded toward $77 on war risks, with the rally likely to continue if tensions escalate.

China’s Economic Data Weakens as Trump Tariffs Hit Manufacturing and Exports
President Trump confirmed a new tariff package on Chinese goods last week. The total tariff rate now stands at 55%, including the existing 25% from his first term. This announcement came as China released new economic data showing signs of strain.
The chart below shows that China’s industrial output grew by only 5.8% in May, marking the slowest pace in six months. In April, output had risen by 6.1%. This decline signals weakening momentum in factory activity and export production.
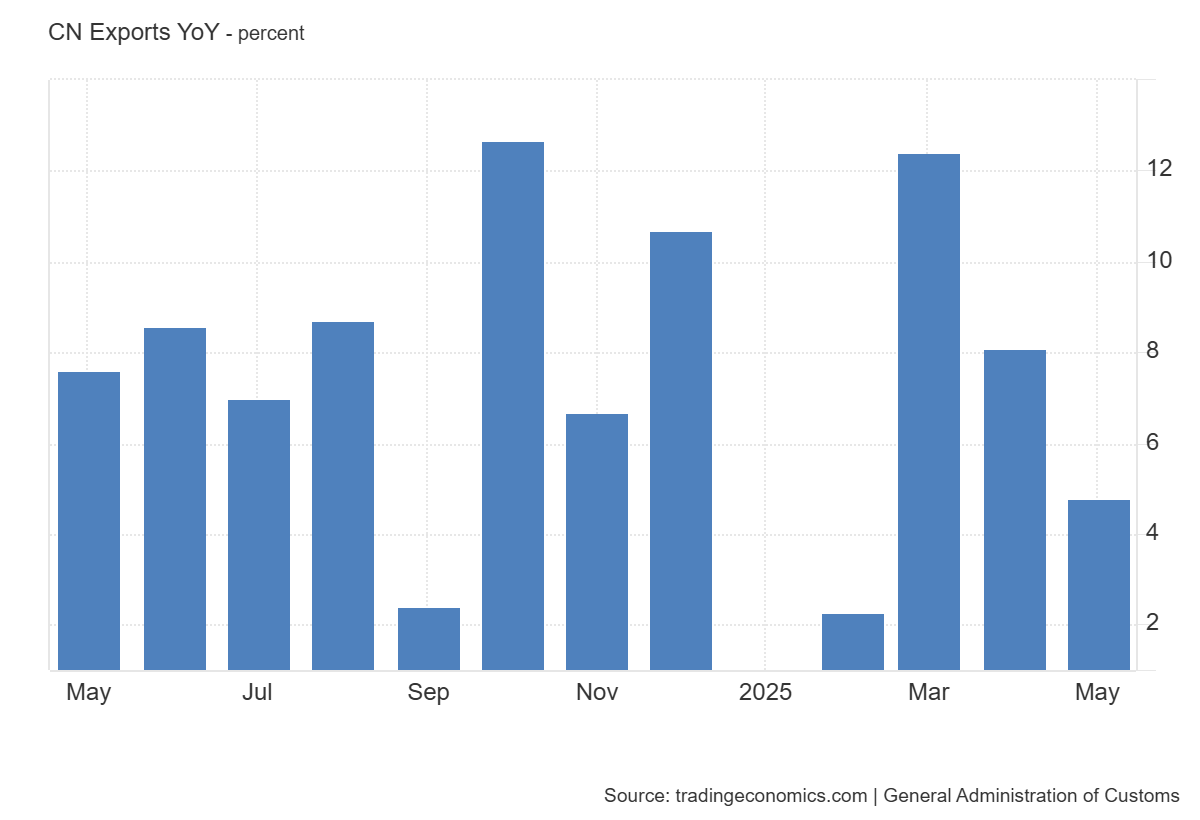
Moreover, exports to the US have also dropped. However, the chart below shows that China’s total exports still grew by 4.8% in May, although the steep decline in U.S.-bound shipments offset this growth.
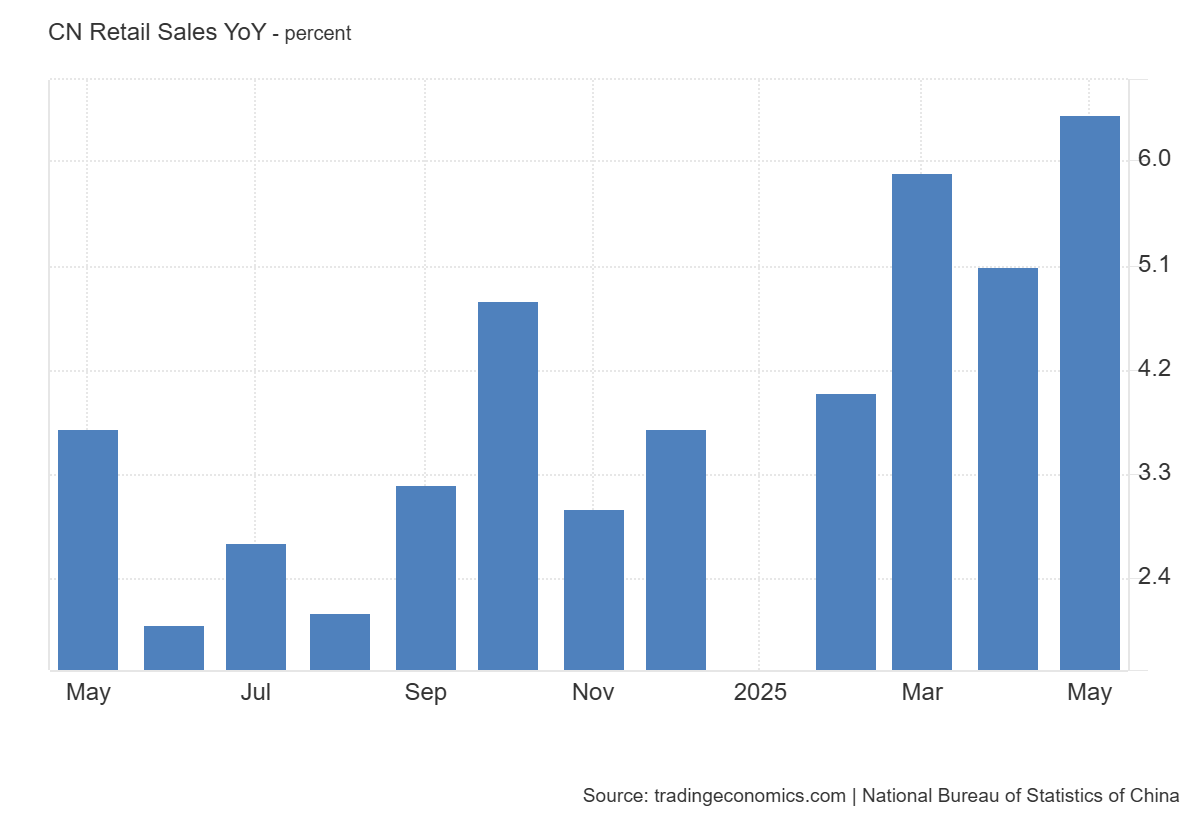
On the other hand, retail sales in China increased to 6.4% in May, up from 5.1% in April. This marks the fastest growth since December 2023. The rise was driven by strong Labour Day holiday spending and the early launch of the “618” online shopping festival.
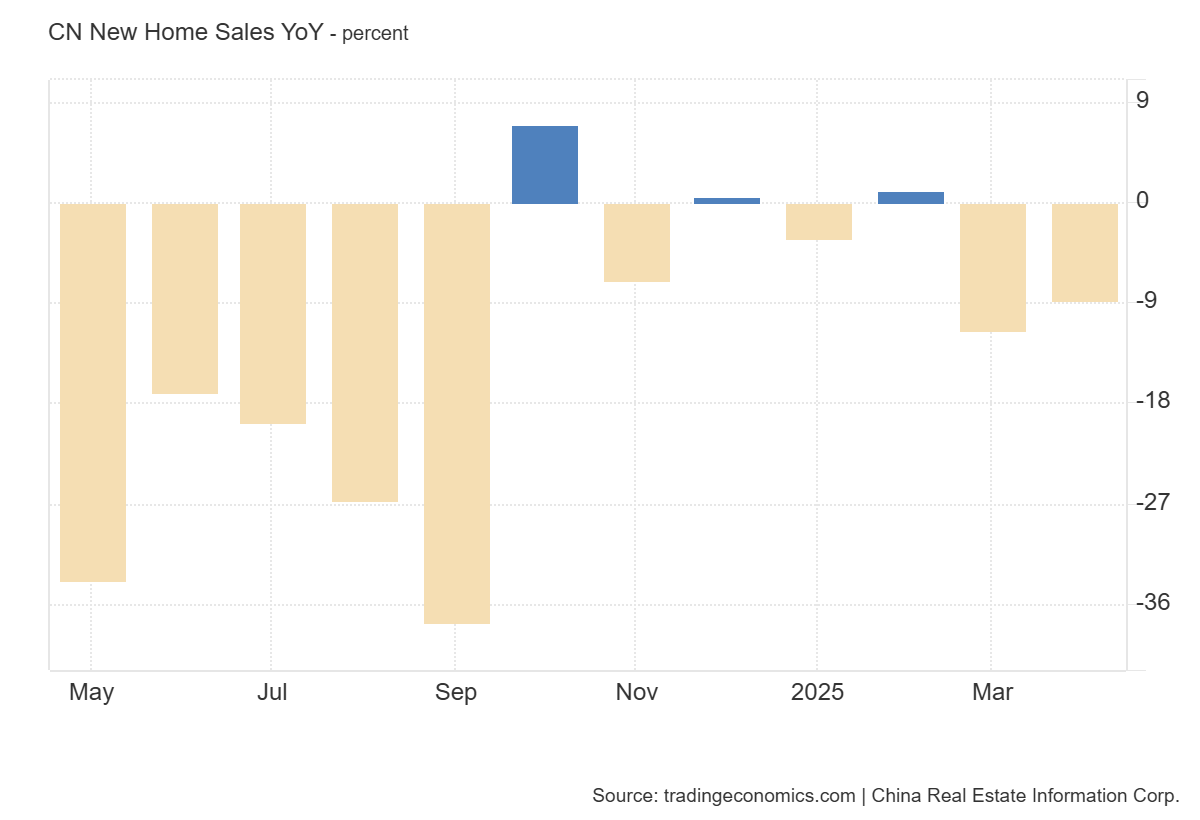
Despite the boost in consumer activity, China’s overall growth outlook remains fragile. The housing sector continues to slump, with new home sales declining. Fixed asset investment grew by just 3.7% in the first five months, below the expected 3.9%. These indicators reflect weak domestic demand and persistent structural challenges.
Trump’s tariff hike now threatens to deepen these challenges. Higher trade barriers will likely further reduce China’s exports to the US. In turn, this may weaken Chinese factory output and increase pressure on its economy.
Iran-Israel Conflict Impact Safe-Haven Demand
Tensions in the Middle East escalated after Iran launched missiles at Israel, responding to Israeli strikes on nuclear facilities. The risk of broader regional war has surged. This uncertainty has rattled global markets.
Gold (XAUUSD) prices climbed on safe-haven demand. Meanwhile, the US dollar remains under bearish pressure, which boosts EUR/USD and keeps USD/CHF in a long-term downtrend. The spike in volatility followed a familiar pattern: stocks dropped, Treasuries gained, and gold rallied.
As fears mount, safe-haven assets may continue to outperform while risk-sensitive markets, such as equities, face downward pressure.
The G7 summit also focused on how geopolitical tensions could disrupt global supply chains, particularly in the energy and critical minerals sectors. Leaders expressed concern that prolonged conflict in the Middle East could drive WTI crude oil (CL) prices higher and strain efforts to control inflation. Rising energy costs would put more pressure on central banks, which are already struggling to strike a balance between growth and price stability.
US officials at the summit defended recent tariff measures as necessary for national interest. However, several allies warned that protectionist policies and regional wars could further fragment the global economy.
Iran Strikes Drive Rebound Toward $77 Resistance.
The monthly chart for WTI crude oil shows a strong rebound following Israel’s launch of strikes on Iran. This rebound has pushed the price toward the resistance level within the symmetrical triangle, located around the $77 area. However, the move reflects heightened volatility driven by the geopolitical crisis, which could lead to unpredictable price action in the coming weeks.
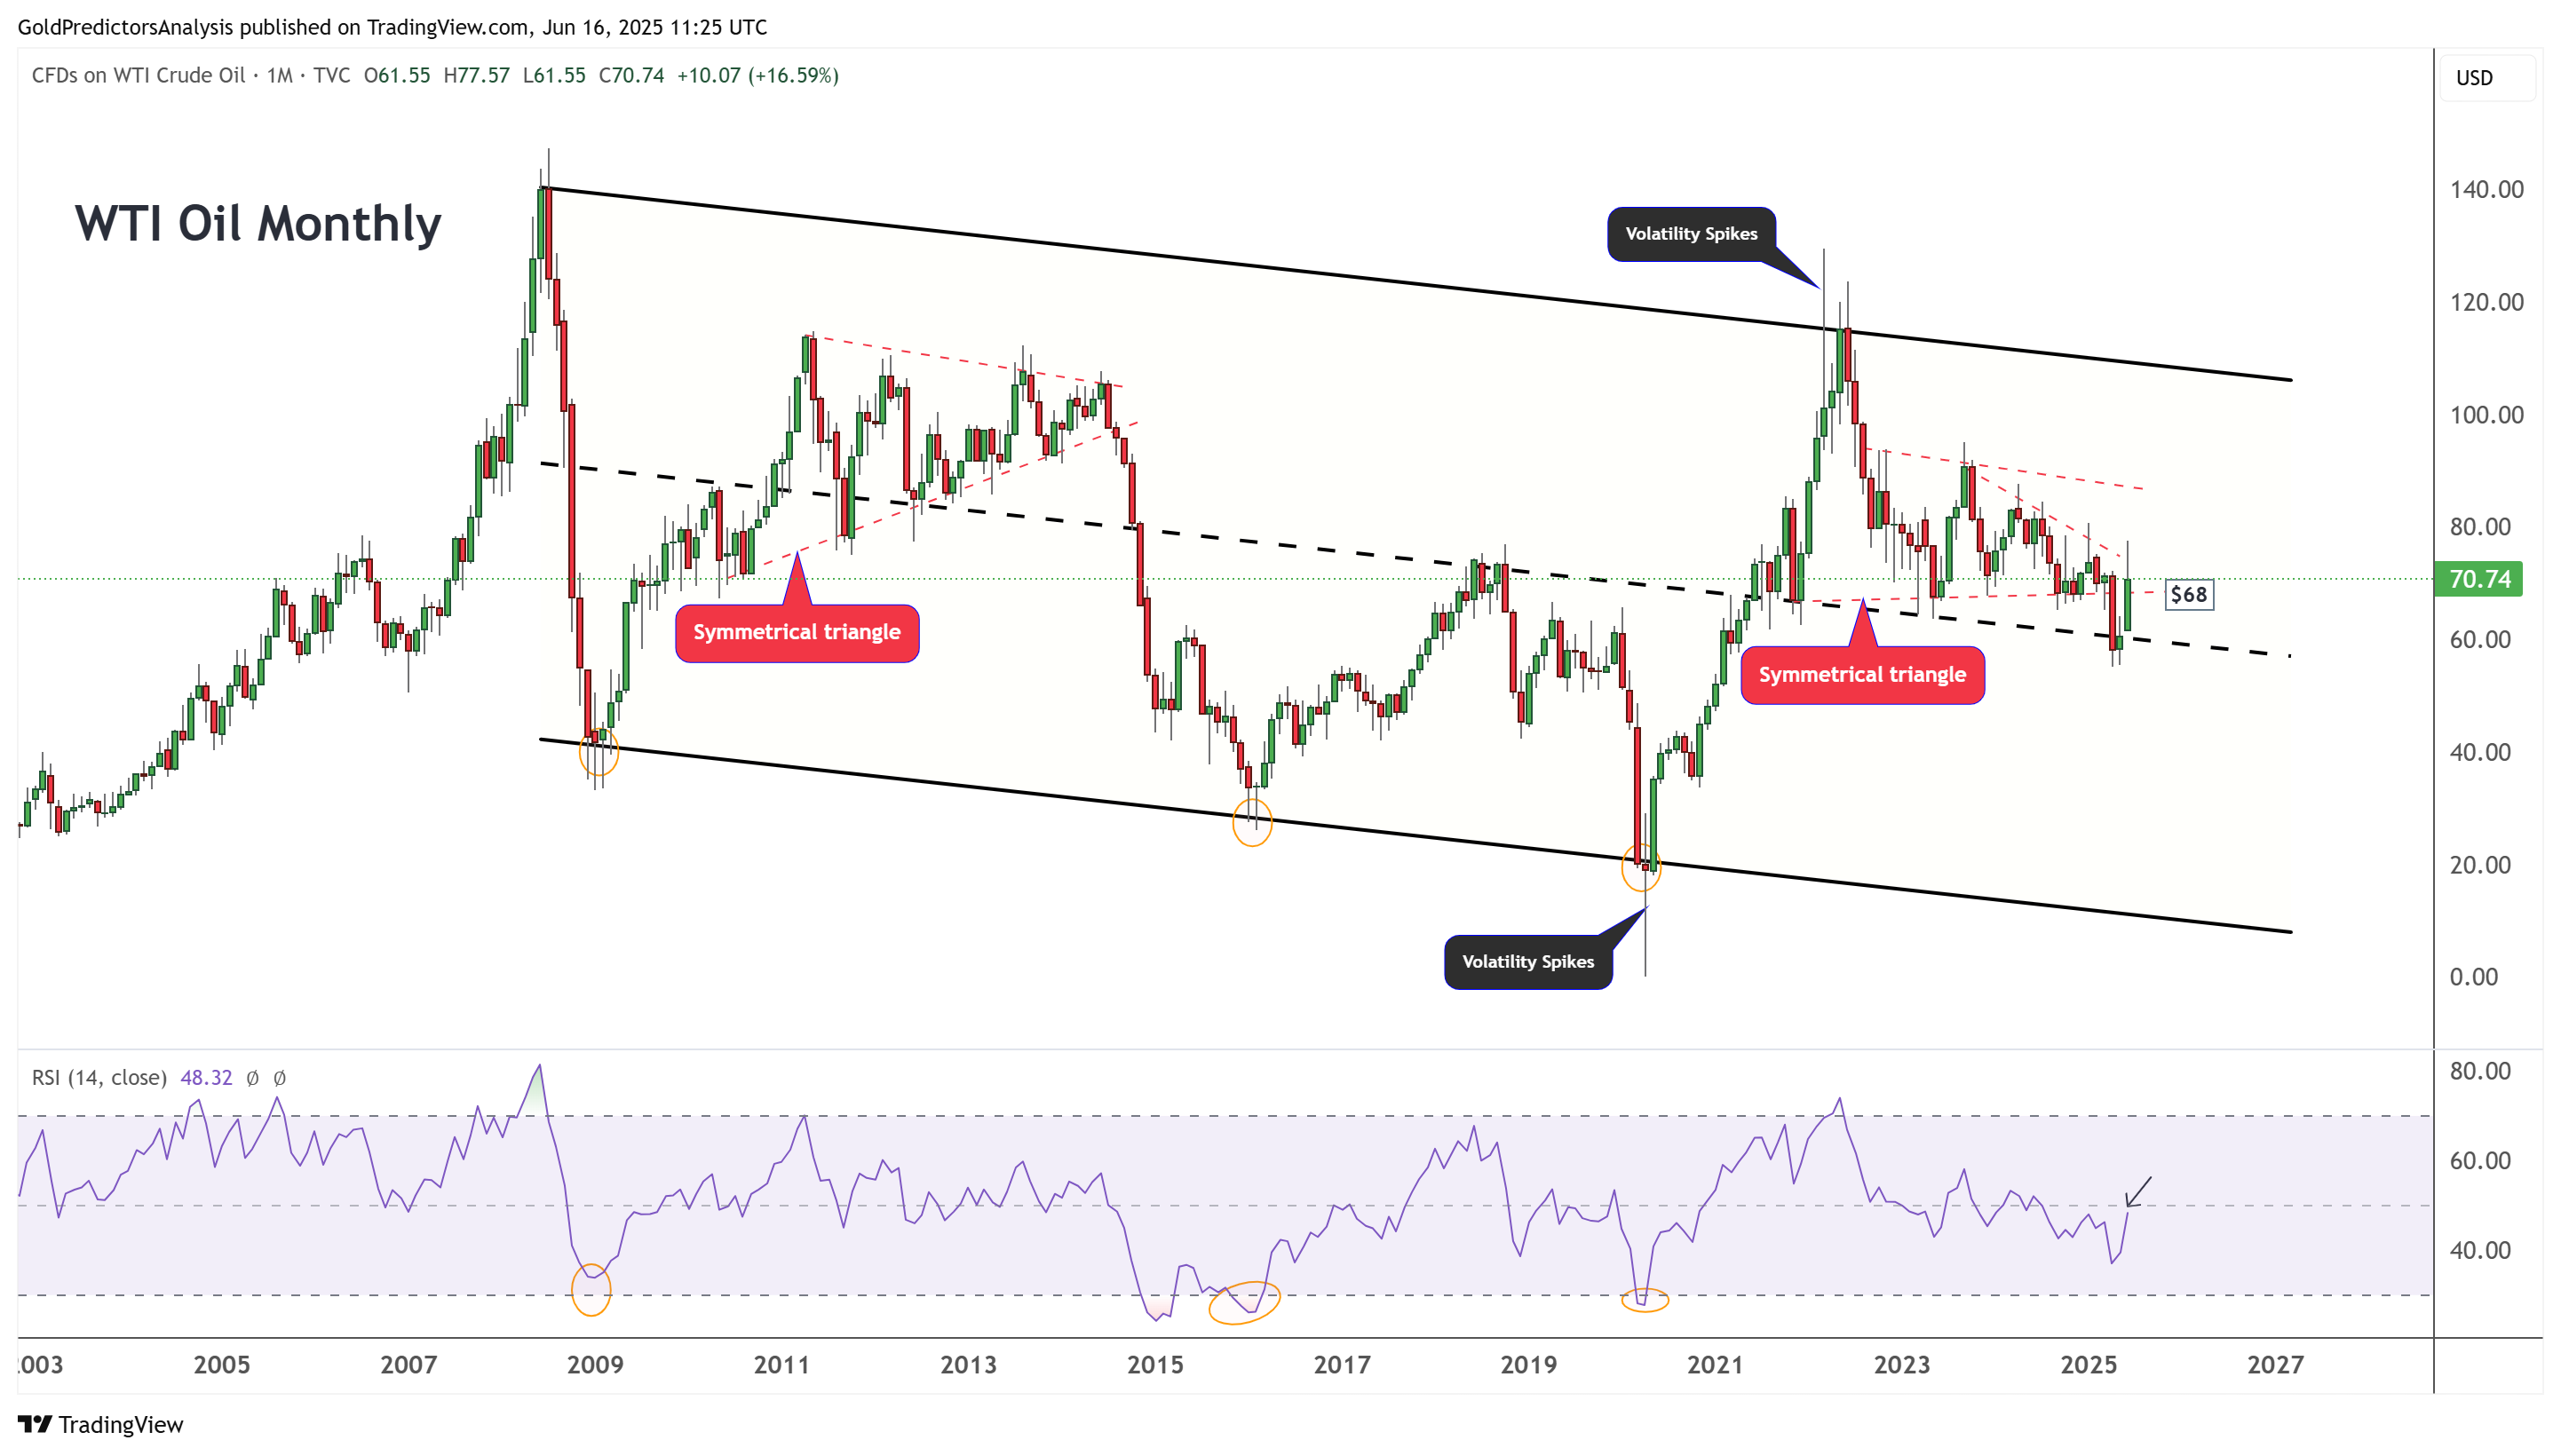
The chart also shows a similar symmetrical triangle that formed between 2011 and 2014. A breakdown from that pattern triggered a significant move. However, the price has held above the long-term support of nearly $55 and has started to rebound this time. A breakout above $90 would likely trigger a strong rally toward the $110 area.
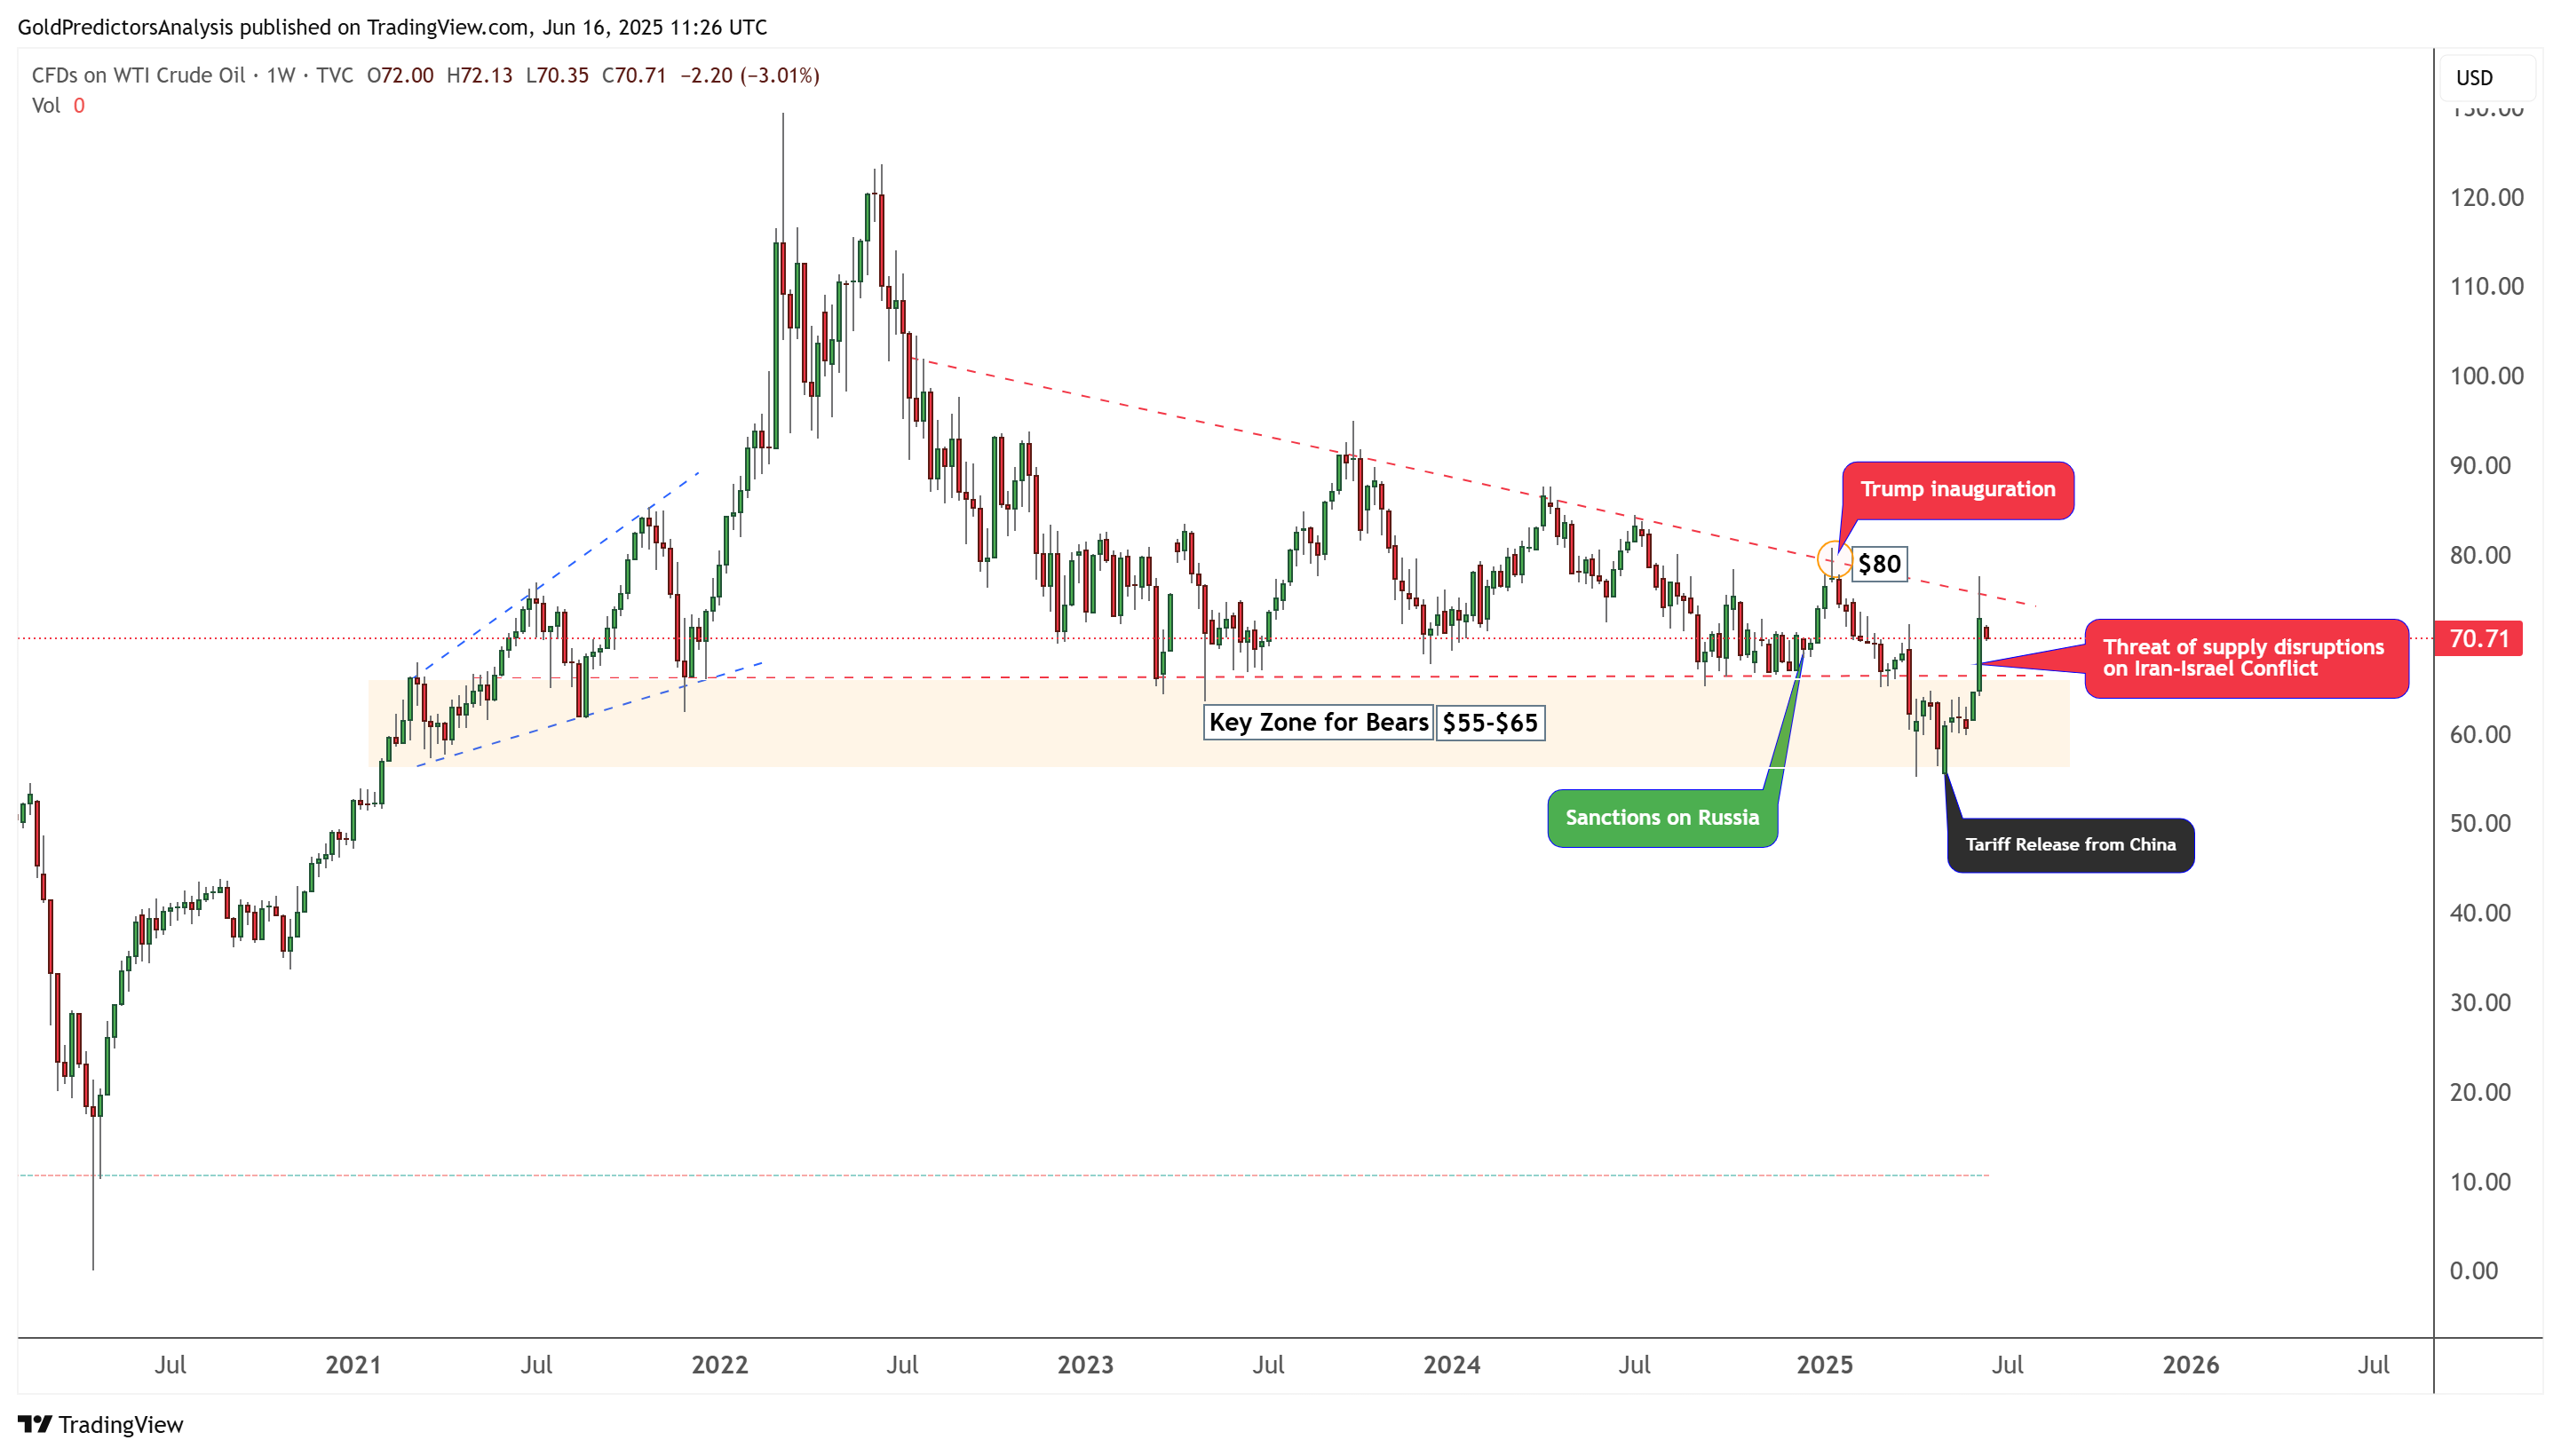
Threat of Supply Disruptions Fuel Oil Rally Toward $100
The weekly chart for WTI crude oil shows a rebound from the long-term support zone, highlighted in orange on the chart. The price is bound within the red dotted trend lines and consolidating amid ongoing global events in 2024 and 2025.
Sanctions on Russia triggered an earlier rebound toward the $80 resistance level. However, Trump’s inauguration pushed prices back down toward the long-term support at $55. The recent release of new tariffs on China sparked another rally, followed by a surge driven by fears of supply disruptions from the Iran-Israel conflict.
A break above $80 would confirm a breakout from the triangle pattern and could initiate continued bullish momentum toward the $100 region.
About the Author
Bob MasonChief Crypto Boss
123456789 30 He has written extensively for a broader audience and his current focus is on developments relating to the financial markets including, but not limited to currencies, commodities, alternative asset classes, and global equities.


Advertisement