
Advertisement
Advertisement
Natural Gas and Oil Forecast: $63.86 Ceiling Capping WTI—Can Bulls Push Through?
By:
Key Points:
- WTI crude retreats to $63 as OPEC+ output boost and easing Canadian wildfires reduce supply disruption fears.
- U.S. crude inventories drop by 3.3M barrels—far more than expected—keeping a floor under oil prices amid volatility.
- Natural gas stalls near $3.70 with trendline resistance holding firm; watch $3.643 support for next directional cue.

Market Overview
WTI crude futures settled near $63 per barrel on Wednesday, easing from recent highs as OPEC+ signaled plans to increase output, which tempered concerns about global supply tightness. Meanwhile, Canadian wildfires, previously curbing about 7% of national production, eased with rainfall, allowing oil sands facilities to resume activity.
However, prices remained supported by heightened geopolitical tensions and a sharper-than-expected 3.3 million barrel drop in U.S. crude inventories, far exceeding the 0.9 million barrel estimate.
Market volatility persists as supply recovery efforts clash with rising uncertainty in key producing regions, impacting both oil and natural gas outlooks globally.
Natural Gas Price Forecast
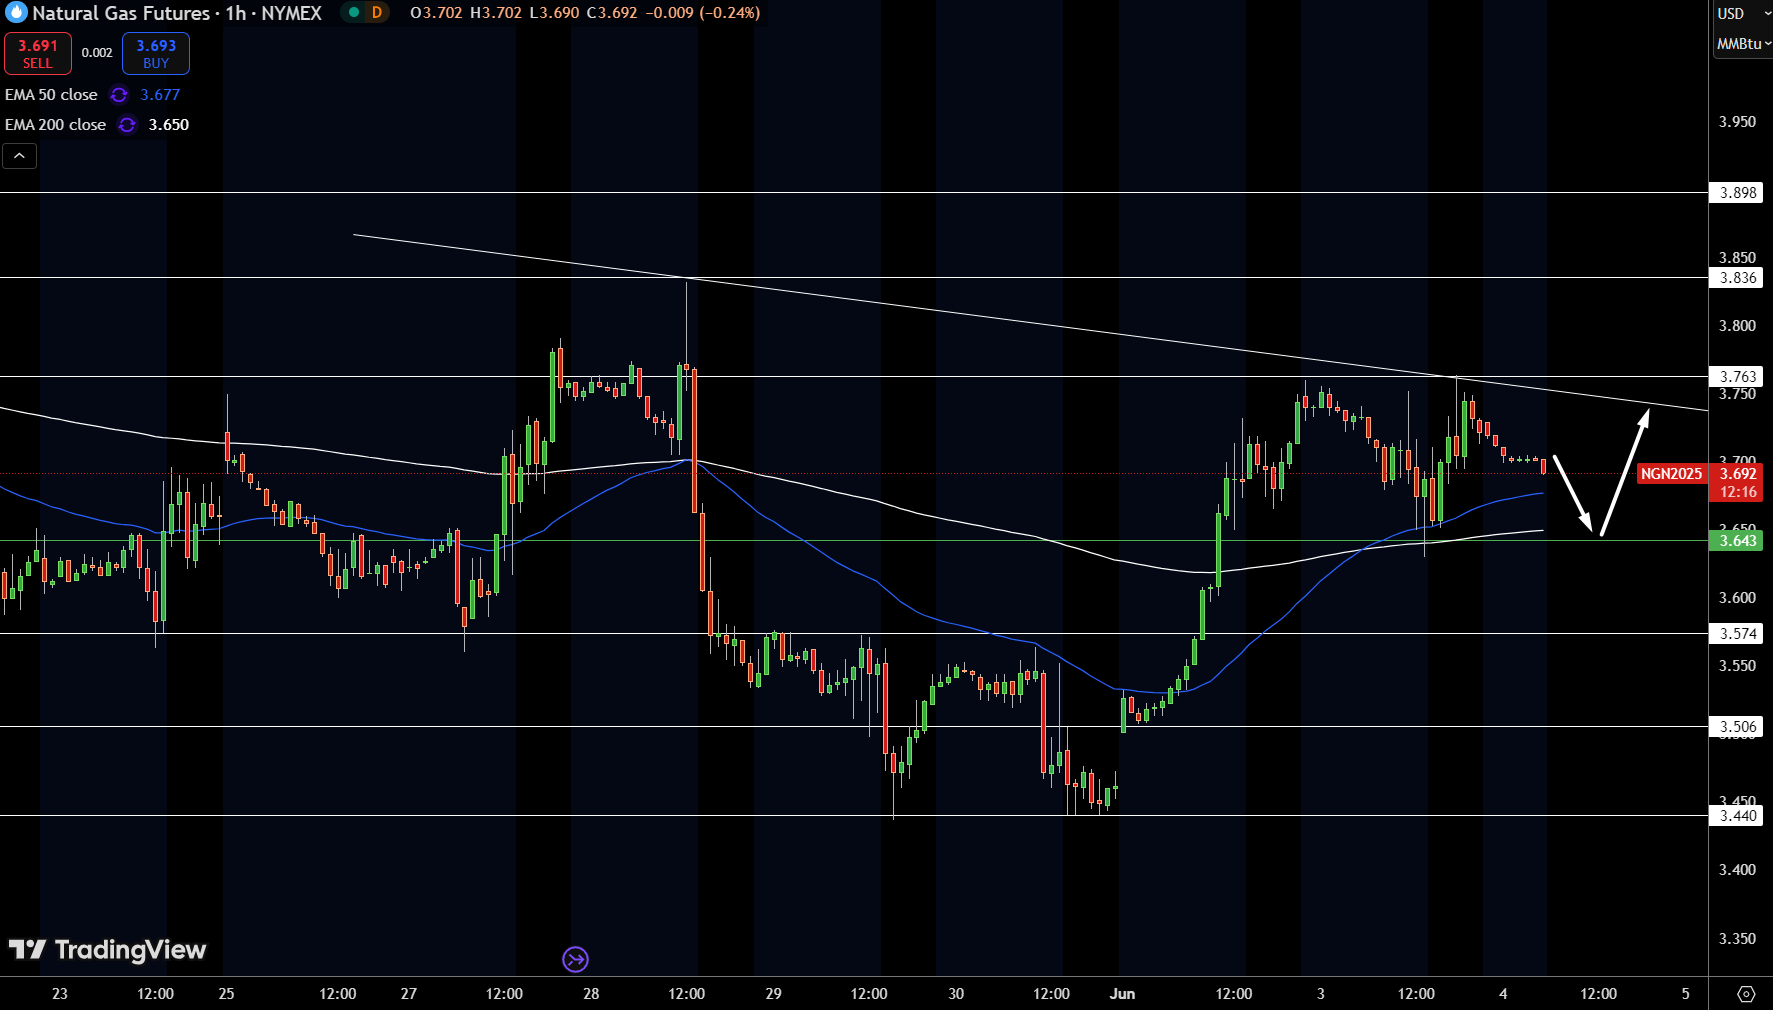
Natural Gas (NGN2025) continues to respect the descending trendline from the May highs, with price action stalling near $3.70. The rejection near $3.763 aligns with the upper boundary of the pattern, while immediate support sits at $3.643, where the 200-hour EMA also converges.
A break below this level could open the door to $3.574 or even $3.506. Price remains squeezed between declining resistance and rising moving averages, signaling an upcoming directional move.
For now, the bias is neutral, with bulls needing a close above $3.763 to shift momentum. Until then, traders should monitor $3.643 as the next decision point.
WTI Oil Price Forecast
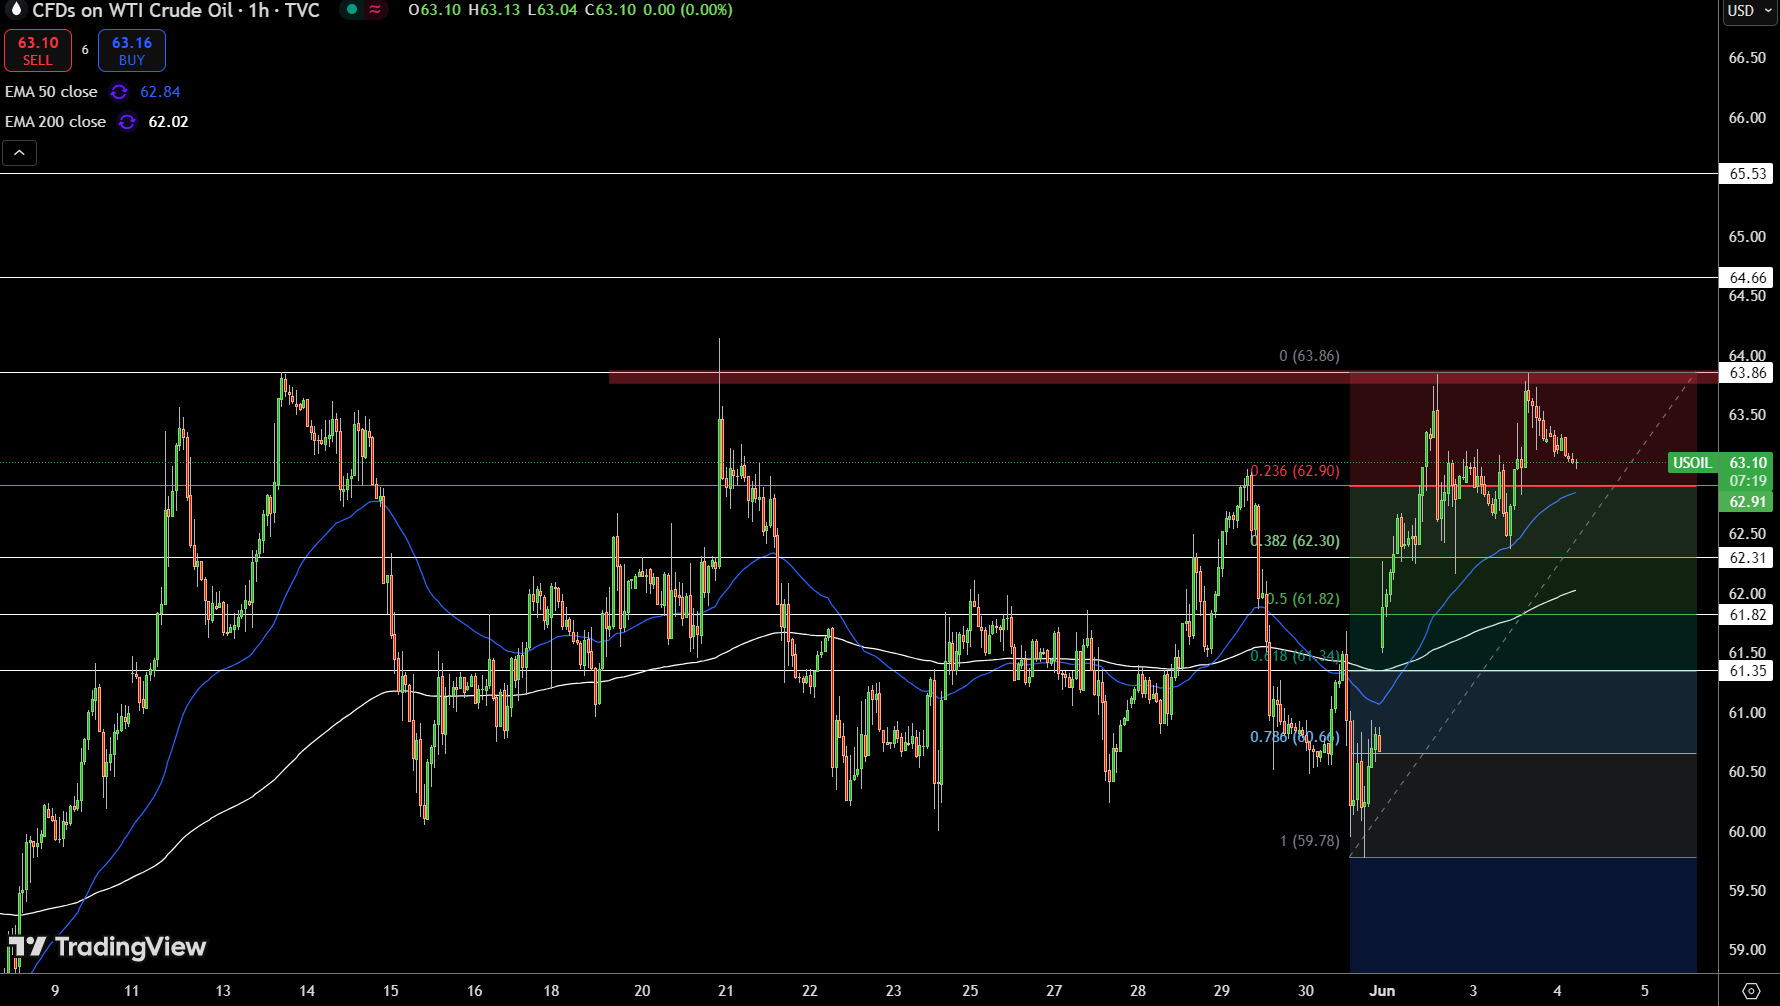
WTI crude (USOIL) is retreating from the $63.86 resistance level, a point that has served as a firm ceiling since mid-May. The price is now testing minor support near $62.90, which aligns with the 23.6% Fibonacci retracement level from the recent low of $59.78 to the high of $63.86.
The 50-EMA and 200-EMA on the 1-hour chart are both trending higher and converging near $62.30–$62.00, offering a potential demand zone. If this area holds, buyers may look to retest $63.86.
However, a clean break below $62.30 would expose $61.82 and shift the bias toward short-term weakness. Price action remains within a rising structure, but upside conviction depends on reclaiming $63.50 with sustained momentum.
Brent Oil Price Forecast
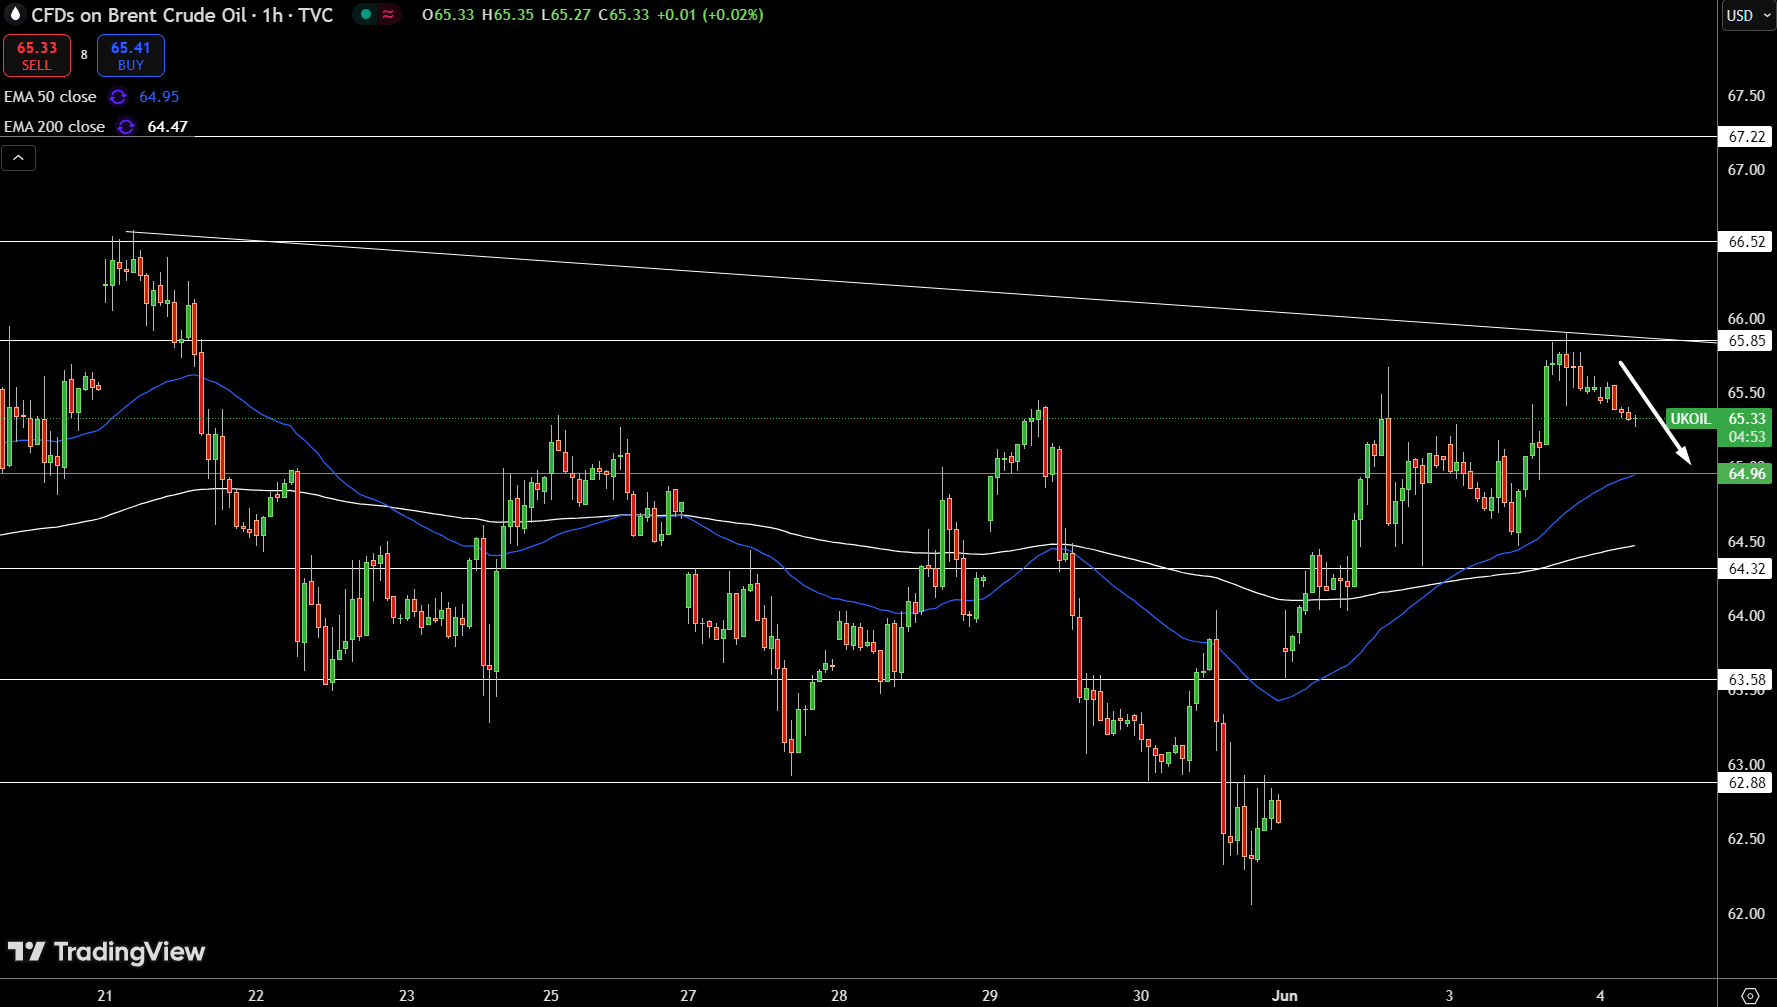
Brent crude (UKOIL) is retreating from the descending trendline resistance at $65.85, with price action showing hesitation below a key confluence zone. The 50- and 200-hour EMAs are stacked below at $64.95 and $64.47, forming immediate support.
A break below $64.96 could expose $64.32 and confirm a near-term bearish shift. Price has struggled to sustain momentum above the trendline, reinforcing the downward pressure that began in late May. Without a decisive push through $65.85, the setup favors a correction.
Watch for a close below $64.96 to validate short-term weakness. Until then, Brent remains trapped between compressing moving averages and horizontal levels, lacking a clear breakout signal.
About the Author
Bob MasonChief Crypto Boss
123456789 30 He has written extensively for a broader audience and his current focus is on developments relating to the financial markets including, but not limited to currencies, commodities, alternative asset classes, and global equities.


Advertisement