
Advertisement
Advertisement
BTC Price Forecast: Fed Rate Path, Mt. Gox Repayments Could Influence Market
By:
Key Points:
- Bitcoin dropped 0.38% on Sunday as the broader crypto market declines, closing at $65,634 ahead of crucial US economic data.
- BTC-spot ETFs saw $1.1B in weekly inflows, the highest since July, boosting Bitcoin demand despite supply-side risks.
- Expectations of a dovish Fed rate path and soft-landing signal could boost Bitcoin demand in the BTC-spot ETF market.

In this article:
Bitcoin Faces a Crucial Test as US Economic Indicators Loom
On Sunday, September 29, BTC dropped by 0.38%, reversing a 0.12% gain from the previous session, closing at $65,634. BTC tracked the broader crypto market, which declined by 0.28% to a total market cap of $2.254 trillion.
US Labor Market Services Sector Data: A Test for US BTC-spot ETF Demand
It could be a pivotal week for the global financial markets. Upcoming US labor market and services sector data may give insights into the economic outlook and the Fed rate path.
Thursday’s ISM Services PMI and Friday’s crucial US Jobs Report could signal a soft landing. The economic indicators may also support a 50-basis point November Fed rate cut. Expectations of a soft landing, combined with a more dovish Fed rate path, could boost demand for US BTC-spot ETFs and BTC.
US BTC-spot ETF Market Inflows Boost BTC Demand
Shifting focus to ETF inflows, BTC climbed to a September 27 high of $66,517. The US BTC-spot ETF market saw total net inflows of $1,106.5 million, pushing BTC to its highest level since July 31. Weekly inflows were their highest since the week ending July 19.
ETF Store President Nate Geraci commented on Friday’s US BTC-spot ETF market inflows:
“Nearly $400mil into spot bitcoin ETFs today… For context, out of 500 ETFs launched in 2024, less than 25 have taken this amount in for *entire year*. ‘Flighty degen retail’ apparently having a second look.”
Geraci shared Degen retail’s Friday move into US BTC-spot ETFs, saying,
“Degen retail put a staggering $500mil into spot bitcoin ETFs today…*$1.1bil* for the week. That’s definitely gonna help the desperately flat holdings.”
Rising demand for BTC-spot ETFs may signal a positive BTC price outlook. However, investors should track Mt. Gox-related news.
Mt. Gox Repayments: A Possible BTC Headwind
On September 25, Arkham Intelligence shared news of Mt. Gox emptying four of their wallets, fueling speculation about more repayments.
According to Arkham Intelligence, Mt. Gox has a stockpile of 44,905 BTC ($2,889.4 million) to repay its creditors. Repayment to creditors could lead to a surge in sell orders on crypto exchanges, possibly impacting supply-demand trends. Oversupply risk remains a BTC headwind, with the US government currently holding 203,239 BTC, equivalent to $13.09 billion.
US Economic Calendar
On Monday, September 30, Fed Chair Powell is on the calendar to speak. Insights into the economic outlook and the Fed rate path may influence buyer demand for US BTC-spot ETFs.
Additionally, investors should monitor news updates from the Middle East. BTC has previously retreated in response to fears of a wider regional conflict.
Investors should remain alert, with upcoming US economic data, US BTC-spot ETF flows, and Mt. Gox transfers likely to affect buyer demand for BTC and the broader market. Stay updated with our latest news and analysis to manage your BTC and crypto exposures.
Technical Analysis
Bitcoin Analysis
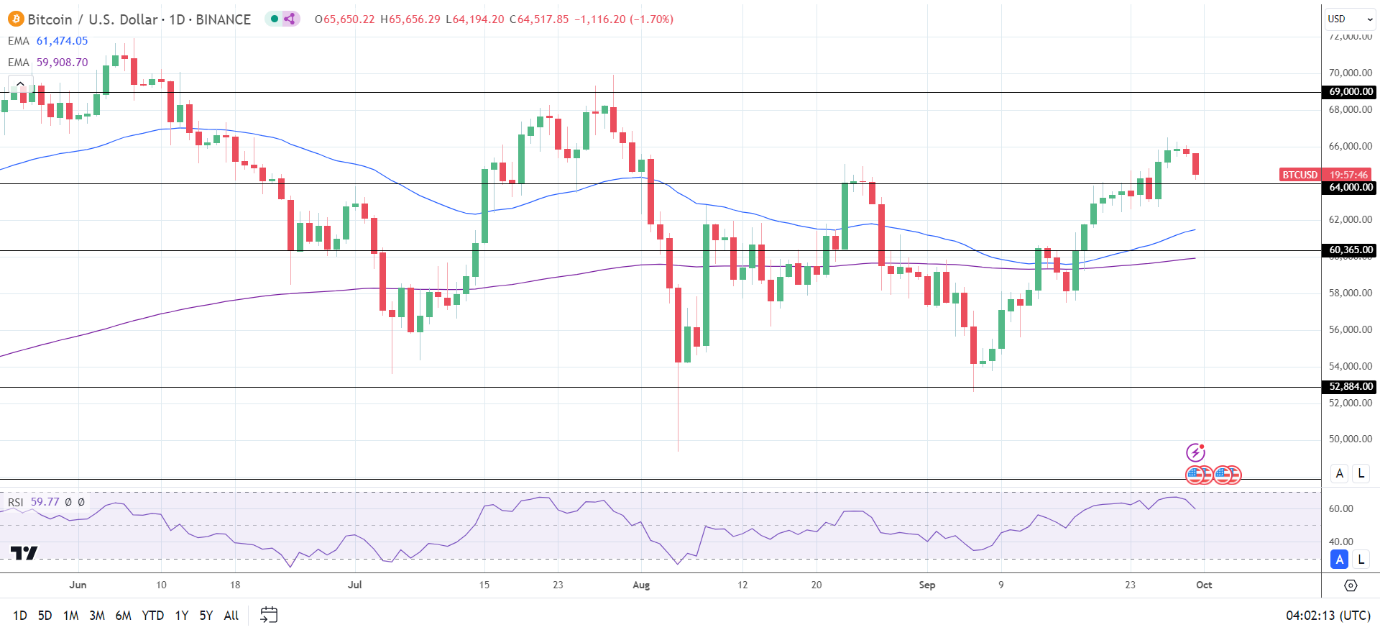
BTC remains well above the 50-day and 200-day EMAs, confirming bullish price signals.
A break above the September 27 high of $66,517 could indicate a return to $67,500. Furthermore, a breakout from $67,500 may give the bulls a run at the $69,000 resistance level and the $70,000 level.
Investors should consider Fed Chair Powell’s comments, news from the Middle East, Mt. Gox transfers, and US BTC-spot ETF market flows.
Conversely, a break below the $64,000 support level could bring the $60,365 support level into play.
With a 59.77 14-day RSI reading, BTC may return to $67,500 before entering overbought territory.
Ethereum Analysis
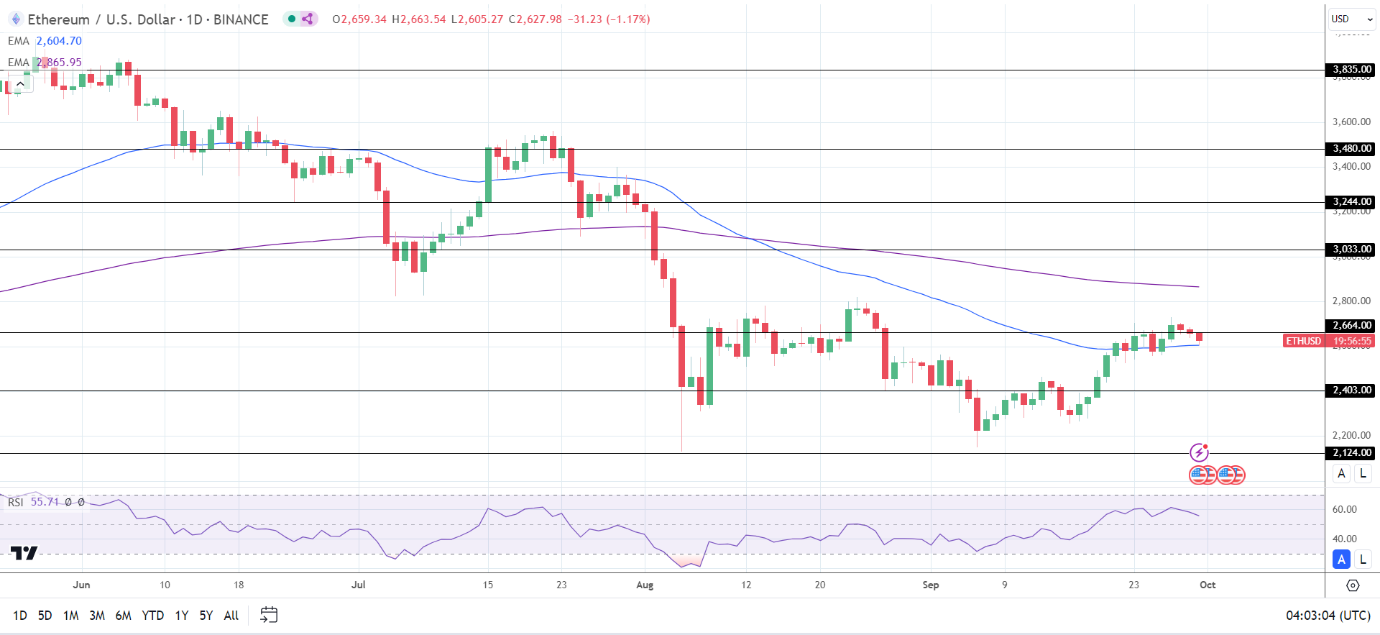
ETH hovers above the 50-day EMA while remaining below the 200-day EMA, affirming bullish near-term but bearish longer-term price signals.
An ETH break above the $2,664 resistance level could support a move toward $2,800. Furthermore, a return to $2,800 may bring the $200-day EMA into play.
US ETH-spot ETF market-related updates also require consideration.
Conversely, an ETH drop below the 50-day EMA could bring the $2,403 support level into play.
The 14-period Daily RSI reading, 55.71, indicates an ETH climb to the 200-day EMA before entering overbought territory.
About the Author
Bob MasonChief Crypto Boss
TEST 30 He has written extensively for a broader audience and his current focus is on developments relating to the financial markets including, but not limited to currencies, commodities, alternative asset classes, and global equities.
Latest news and analysis


Advertisement